Example: bachelor of science
Name: GCSE (1 – 9) Velocity Time Graphs
His total time for running the race is 20.32s. Below is a sketch of the speed-time graph for the motion of the sprinter. ... Here is the velocity-time graph of a car for 50 seconds. Work out the average acceleration during the 50 seconds. Give the units of your answer. Estimate the time during the 50 seconds when
Tags:
Information
Domain:
Source:
Link to this page:
Documents from same domain
Mathematics (Linear) 1MA0 PROBABILITY & TREE …
www.mathsgenie.co.ukEdexcel GCSE Mathematics (Linear) – 1MA0 PROBABILITY & TREE DIAGRAMS Materials required for examination Items included with question papers Ruler graduated in centimetres and Nil
Mathematics (Linear) 1MA0 ALGEBRA: …
www.mathsgenie.co.ukEdexcel GCSE Mathematics (Linear) – 1MA0 ALGEBRA: COLLECTING LIKE TERMS Materials required for examination Items included with question papers Ruler graduated in centimetres and Nil
Mathematics (Linear) 1MA0 ALGEBRA: INEQUALITIES
www.mathsgenie.co.ukEdexcel GCSE Mathematics (Linear) – 1MA0 ALGEBRA: INEQUALITIES Materials required for examination Items included with question papers Ruler graduated in centimetres and Nil
Mathematics (Linear) 1MA0 PERCENTAGES - Maths …
www.mathsgenie.co.ukEdexcel GCSE Mathematics (Linear) – 1MA0 PERCENTAGES Materials required for examination Items included with question papers Ruler graduated in centimetres and Nil

Mathematics (Linear) 1MA0 3D PYTHAGORAS - …
www.mathsgenie.co.ukEdexcel GCSE Mathematics (Linear) – 1MA0 3D PYTHAGORAS Materials required for examination Items included with question papers Ruler graduated in centimetres and Nil
Mathematics (Linear) 1MA0 Mean, Median, Mode …
www.mathsgenie.co.ukEdexcel GCSE Mathematics (Linear) – 1MA0 Mean, Median, Mode & Range Materials required for examination Items included with question papers Ruler graduated in centimetres and Nil
Mathematics (Linear) 1MA0 FACTORS, MULTIPLES …
www.mathsgenie.co.uk9. Here is a list of eight numbers. 5 6 12 20 25 26 28 33 (a) From the list, write down (i) a square number, ..... (ii) a number that is a multiple of 7,
Mathematics (Linear) 1MA0 SOLVNG …
www.mathsgenie.co.ukEdexcel GCSE Mathematics (Linear) – 1MA0 SOLVNG SIMULTANEOUS EQUATIONS GRAPHICALLY Materials required for examination Items included with question papers
Mathematics (Linear) 1MA0 ALGEBRA - Maths Genie
www.mathsgenie.co.ukEdexcel GCSE Mathematics (Linear) – 1MA0 ALGEBRA: EXPAND & FACTORISE QUADRATICS Materials required for examination Items included with question papers
Mathematics (Linear) 1MA0 SEQUENCES - Free …
www.mathsgenie.co.uk1. Here are the first 5 terms of an arithmetic sequence. 6, 11, 16, 21, 26 Find an expression, in terms of n, for the nth term of the sequence. (Total 2 marks) 2. Here are the first five terms of a number sequence.
Related documents
The Running Time of Programs - Stanford University
infolab.stanford.edurunning time of the program by only 10%. On the other hand, cutting in half the running time of the 10% of the program where 90% of the time is spent reduces the overall running time by 45%. Analysis of a Program To analyze a program, …

Joe Rubio’s Fundamental Training ... - Running Warehouse
img.runningwarehouse.comable to do right out of their familiar collegiate environment. Patience, faith and hope are all key components in the process. Real improvement will take time and unfortunately most of it will require the individual athlete to step up and perform the necessary work alone. In post collegiate running few care if you improve and even

Running training plan: Half marathon beginner
www.macmillan.org.ukfirst time. This plan will see you training 3-4 times a week and we would encourage you to complement the running outline with core conditioning and XT as outlined in our Running Guide. This training plan, put together by our coaching partners Running With Us, is designed to get you

Running head: CHILD CASE STUDY: ZOE FRANK Child Case …
stu.westga.edumajority of time but not shy; asserts herself well. Zoe seems like a happy, well-adjusted child who is content most of the time Emotional problems None Anxious at times, mountains for mole hills, very dramatic. Occasionally over dramatic when she feels left out. Can be brought to tears if she feels something is not fair. Did not observe any

Running Engaging Online Events - Zoom Video
explore.zoom.usRunning Engaging Online Events | April 2020 | 6 Build an Interactive Experience It’s time to get organized by designing and building the attendee experience. An online event experience can be much more than your attendees viewing a live feed or video. Think about the attendee experiences you would have created before,

2022 RUNNING FOR OFFICE GUIDE - West Virginia
sos.wv.govRUNNING FOR OFFICE GUIDE WEST VIRGINIA SECRETARY OF STATE’S OFFICE ELECTIONS DIVISION December 23, 2021 Charleston, WV 25305 CONTACT Office of the Secretary of State State Capitol Building, 157-K PHONE: Main: (304) 558-8000 Fax: (304) 558-8381 Toll Free: (866) 767-8683 WEBSITE: www.sos.wv.gov EMAIL: [email protected]

RUNNING WILD TEACHERS RESOURCE PACK
d3dwwd0h9gl2qw.cloudfront.netin and out of consciousness. Has his luck finally run out? Fortunately, he reaches an animal sanctuary on the edge of the jungle just in time. The sanctuary is a special place where orphaned and injured orangutans are cared for. Just as his illness takes a turn for the worst, the owner of the sanctuary, the kind
Running on Empty
compassionfatigue.orgRunning on Empty p.2 illness, and 10% had been away for mental health reasons. Eight out of ten nurses accessed their EAP (employee assistance program) which is over twice as high as EAP use by the total employed population. In addition, nurses reported on the job violence and were found “more
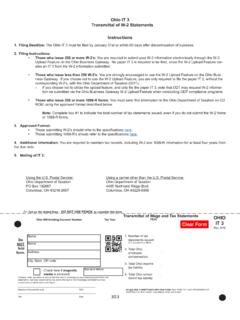
OHIO IT 3
tax.ohio.govOhio IT 3. Transmittal of W-2 Statements. Instructions. 1. Filing Deadline: The Ohio IT 3 must be filed by January 31st or within 60 days after discontinuation of business.
PE - Circuit Training The idea for this activity arose out ...
www.primaryresources.co.ukThe idea for this activity arose out of trying to fill the 30 minute PE slot on a Friday afternoon which is shared by 52 children! We set up a circuit of different activities where the children aimed to score as many points as possi ble and to improve their score over 4 weeks. Our hall is quite small but we found that we had plenty of