Example: stock market

National Distributions of Cumulative Percents for ACT Test ...

Distributions of Cumulative Percents for ACT Test ScoresACT-Tested High School Graduates from 2015, 2016 and 2017 Note: These National norms are the source of Ranks, for multiple-choice tests, displayed on ACT reports during the 2017-2018 testing year. These norms with a sample size of 6,044,816, are based on 2015, 2016 and 2017 graduates.

score english mathematics reading science composite stem score 36 100 100 100 100 100 100 36 35 99 99 99 99 99 99 35 34 98 99 98 99 99 99 34 33 96 98 96 98 98 98 33

Information

Domain:

Source:

Link to this page:

Please notify us if you found a problem with this document:

Other abuse

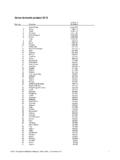
Transcription of National Distributions of Cumulative Percents for ACT Test ...

1 Distributions of Cumulative Percents for ACT Test ScoresACT-Tested High School Graduates from 2015, 2016 and 2017 Note: These National norms are the source of Ranks, for multiple-choice tests, displayed on ACT reports during the 2017-2018 testing year. These norms with a sample size of 6,044,816, are based on 2015, 2016 and 2017 graduates.


Related search queries