Transcription of Natural Gas Monthly - EIA
1 Office of Energy Production, Conversion, and Delivery Natural Gas Monthly August 2019 Department of Energy Washington, DC 20585 August 2019 Energy Information Administration | Natural Gas Monthly ii This report was prepared by the Energy Information Administration (EIA), the statistical and analytical agency within the Department of Energy. By law, EIA s data, analyses, and forecasts are independent of approval by any other officer or employee of the United States Government. The views in this report therefore should not be construed as representing those of the Department of Energy or other Federal agencies. August 2019 Energy Information Administration | Natural Gas Monthly Contacts The Natural Gas Monthly (NGM) is prepared by the Energy Information Administration (EIA), Department of Energy (DOE), under the direction of the Director of the Office of Energy Production, Conversion, and Delivery, Robert Merriam.
2 General inquiries about energy data can be directed to EIA s Office of Communications via email at Specific questions about the information in this report may be directed to: Consumption and Consumer Prices .. Michael Kopalek 202 586 4001) Imports and Exports .. Jose Villar 202 586 9613) Natural Gas Production .. Jeffrey Little 202 586 6284) Quality .. Vicki Spangler 202 586 8555) Supplemental Gaseous Fuels .. Michael Kopalek 202 586 4001) Underground Storage .. Jose Villar 202 586 9613) Other contributors to this report include Sharon Belcher, Bridgette Brown, and Gary Long. iii August 2019 Energy Information Administration | Natural Gas Monthly iv Preface The Natural Gas Monthly (NGM) highlights activities, events, and analyses of interest to public and private sector organizations associated with the Natural gas industry.
3 Volume and price data are presented each month for Natural gas production, distribution, consumption, and interstate pipeline activities. Producer related activities and underground storage data are also reported. The data in this publication are collected on surveys conducted by EIA to fulfill its responsibilities for gathering and reporting energy data. Geographic coverage is the 50 States and the District of Columbia. Explanatory Notes supplement the information found in tables of the report. A description of the data collection surveys that support the NGM is provided in the Data Sources section. A glossary of the terms used in this report is also provided to assist readers in understanding the data presented in this publication. All Natural gas volumes are reported at a pressure base of pounds per square inch absolute (psia) and at 60 degrees Fahrenheit.
4 Cubic feet are converted to cubic meters by applying a factor of August 2019 Energy Information Administration | Natural Gas Monthly v Contents Highlights .. 1 Common Abbreviations .. 2 Appendices A. Explanatory Notes .. 101 B. Data Sources .. 109 C. Statistical Considerations .. 115 Glossary .. 125 Tables 1. Summary of Natural Gas Supply and Disposition in the United States, 2014 2019 .. 3 2. Natural Gas Consumption in the United States, 2014 2019 .. 5 3. Selected National Average Natural Gas Prices, 2014 2019 .. 7 4. Natural Gas Imports, 2017 2019 .. 9 5. Natural Gas Exports, 2017 2019 .. 14 6. Gross Withdrawals of Natural Gas in Selected States and the Federal Gulf of Mexico, 2014 2019 .. 24 7. Marketed Production of Natural Gas in Selected States and the Federal Gulf of Mexico, 2014 2019.
5 26 8. Underground Natural Gas Storage All Operators, 2014 2019 .. 29 9. Underground Natural Gas Storage by Season, 2017 2019 .. 30 10. Underground Natural Gas Storage Salt Cavern Storage Fields, 2014 2019 .. 31 11. Underground Natural Gas Storage Storage Fields Other than Salt Caverns, 2014 2019 .. 32 12. Net Withdrawals from Underground Storage, by State, 2017 2019 .. 33 13. Activities of Underground Natural Gas Storage Operators, by State, June 2019 .. 38 14. Natural Gas Deliveries to Residential Consumers, by State, 2017 2019 .. 39 15. Natural Gas Deliveries to Commercial Consumers, by State, 2017 2019 .. 44 16. Natural Gas Deliveries to Industrial Consumers, by State, 2017 2019 .. 49 17. Natural Gas Deliveries to Electric Power Consumers, by State, 2017 2019 .. 54 18. Natural Gas Deliveries to All Consumers, by State, 2017 2019.
6 59 19. Average Citygate Price, by State, 2017 2019 .. 64 20. Average Price of Natural Gas Sold to Residential Consumers, by State, 2017 2019 .. 69 21. Average Price of Natural Gas Sold to Commercial Consumers, by State, 2017 2019 .. 74 22. Average Price of Natural Gas Sold to Industrial Consumers, by State, 2017 2019 .. 79 23. Average Price of Natural Gas Sold to Electric Power Consumers, by State, 2017 2019 .. 84 24. Percentage of Total Deliveries Included in Residential, Commercial, and Industrial Prices, by State, 2017 2019 .. 89 25. Heating Value of Natural Gas Consumed, by State, 2017 2019 .. 96 A1. Methodology for Most Recent Monthly Natural Gas Supply and Disposition Data of Tables 1 and 2 .. 101 C1. Standard Error for Natural Gas Deliveries and Price to Consumers by State, June 2019.
7 123 August 2019 Energy Information Administration | Natural Gas Monthly iv Figures 1. Production, Consumption, and Net Imports of Natural Gas in the United States, 2016 2019 .. 4 2. Natural Gas Deliveries to Consumers in the United States, 2016 2019 .. 6 3. Citygate and Consumer Prices of Natural Gas in the United States, 2016 2019 .. 8 4. Spot Prices of Natural Gas and Natural Gas Plant Liquids in the United States, 2016 2019 .. 8 5. Working Gas in Underground Natural Gas Storage in the United States, 2016 2019 .. 29 6. Percentage of Total Deliveries Included in Residential, Commercial, and Industrial Price Estimates, 2016 2019 .. 95 vi August 2019 Energy Information Administration | Natural Gas Monthly 1 Highlights This issue of the Natural Gas Monthly (NGM) contains state and national level estimates of Natural gas volume and price data through June 2019.
8 Recent analyses of the Natural gas industry are available on the EIA website by clicking the Natural Gas link under the Sources & Uses tab. The two reports listed under Regular weekly Releases along the right side of the Natural gas page are updated regularly. These reports are: weekly Natural Gas Storage Report a weekly report containing estimates of Natural gas in underground storage for the United States and five regions of the United States released each Thursday at 10:30 at the EIA website, except for certain weeks with Federal holidays. The report contains estimates of storage for the current and prior week and comparisons to previous periods. Links are provided to papers describing survey Form EIA 912, " weekly Underground Natural Gas Storage Report," and the estimation methodology. Natural Gas weekly Update a current analysis of the industry each week, including information on Natural gas spot and futures prices and storage activities.
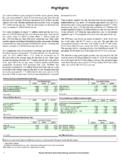
9 This page also provides links to numerous other EIA sites dealing with Natural gas. Other Natural gas data and analyses may be found through the Natural Gas section of EIA s website. August 2019 2 Energy Information Administration | Natural Gas Monthly Abbreviations Common Abbreviations Used in the Natural Gas Monthly Bcf Billion cubic feet CNG Compressed Natural gas DOE Department of Energy EIA Energy Information Administration, Department of Energy FERC Federal Energy Regulatory Commission GOM Gulf of Mexico LNG Liquefied Natural gas Mcf Thousand cubic feet MMcf Million cubic feet NGPL Natural gas plant liquid Tcf Trillion cubic feet August 2019 Energy Information Administration | Natural Gas Monthly 3 Table 1 Table 1. Summary of Natural gas supply and disposition in the United States, 2014 2019 (billion cubic feet)
10 Year and Month Gross Withdrawals Marketed Production NGPL Productiona Dry Gas Productionb Supplemental Gaseous Fuelsc Net Imports Net Storage Withdrawalsd Balancing Iteme Consumptionf 2014 Total 31,405 27,4981,608 25,890 60 1,181 254 283 26,593 2015 Total 32,915 28,7721,707 27,065 59 935 547 268 27,244 2016 Total 32,592 28,4001,808 26,592 57 671 340 216 27,444 2017 January 2,749 2,355154 2,202 5 20 687 13 2,901 February 2,505 2,146140 2,005 5 * 292 28 2,329 March 2,812 2,431159 2,272 5 9 281 39 2,529 April 2,703 2,355154 2,201 5 9 236 34 1,928 May 2,787 2,430159 2,271 5 10 348 22 1,897 June 2,693 2,370155 2,215 5 14 287 8 1,912 July 2,764 2,479162 2,317 6 2 155 37 2,133 August 2,781 2,478162 2,316 6 1 201 17 2,105 September2,767 2,434159 2,275 5 21 323 14 1,923 October 2,907 2,550166 2,384 6 37 254 62 2,037 November2,884 2,535165 2,370 6 45 90 70 2,351 December3,006 2,635172 2,463 6 22 707 88 3,066 Total 33,357 29,1971,906 27,291 66 125 254 375 27,110 2018 January E2,959 E2,586171 E2,415 6 * 896 7 3,310 February E2,724 E2,385163 E2,222 6 38 467 44 2,700 March E3,048 E2,673188 E2,485 6 21 285 18 2,773 April E2,960 E2,598185 E2,413 5 37 32 13 2,336 May E3,082 E2,713193 E2,521 5 45 423 10 2,047 June E2,955 E2,641188 E2,453 6 34 349 26 2,050 July E3,108 E2,784199 E2,585 5 59 186 2 2,346 August E3,180 E2,845205 E2,640 6 74 235 25 2,311 SeptemberE3,135 E2,790200 E2,590 6 88 334 16 2,159 October E3,272 E2,909206 E2,702 6 92 291 50 2,276 NovemberE3,233 E2,855198 E2,657 6 125 205 54 2.