Transcription of Weekly Petroleum Status Report
1 DOE/EIA-0208(2018-06)Distribution Category UC-98 Data for week Ended:February 2, 2018 Includes: Weekly Table A1 (See Page 31) Petroleum Supply Monthly Data for November 2018 Weekly Petroleum Status ReportWeekly Petroleum Status Report / energy information AdministrationiiEIA DATA ARE AVAILABLE IN ELECTRONIC FORMThe tables in the Weekly Petroleum Status Report (WPSR) are posted to the web site after 10:30 Eastern Standard Time (EST) on Wednesdays in CSV and XLS formats. PDF files are posted to the web site after 1:00 on Wednesdays. For some weeks that include holidays, posting is delayed by one customers may also want to take a look at EIA s This week in Petroleum (TWIP) web site ( ) which provides current market analysis and data for crude oil and major Petroleum products. It is generally available at 1:00 EST on Wednesdays. All current EIA publications are available on the EIA web site. Users can view and download selected pages or entire reports, search for information , download EIA data and analysis applications, and find out about new EIA information products and services:World Wide Web: : also offers a listserv service for EIA press releases and other short documents.
2 This service is also used to notify customers of new data and analysis products, changes to current products, and other news of interest. Sign up for one or more listservs by doing the following: Logon to On the left sidebar click on Sign up for email Updates Simply follow the promptsFor further information , and for answers to questions on energy statistics, please contact EIA s National energy information Center at: National energy information Center (NEIC) EI-30, Forrestal BuildingWashington, DC 20585(202) 586-8800 (phone)(202) 586-0727 (fax)9:00 to 4:00 , Eastern Time, M-F E-mail: Release Date: February 7, 2018 This Report was prepared by the energy information administration , the independent statistical and analytical agency within the Department of energy . The information contained herein should be attributed to the energy information administration and should not be construed as advocating or reflecting any policy position of the Department of energy or any other Petroleum Status Report / energy information AdministrationiiiPrefaceThe Weekly Petroleum Status Report (WPSR) provides timely information on supply and selected prices of crude oil and principal Petroleum products.
3 It provides the industry, press, planners, policymakers, consumers, analysts, and State and local governments with a ready, reliable source of current information . Petroleum supply data presented in the WPSR describe supply and disposition of crude oil and Petroleum products in the United States and major regions called Petroleum administration for Defense (PAD) Districts. Geographic coverage in the WPSR includes the 50 States and District of Columbia. territories are treated as import sources but are otherwise excluded from Weekly Petroleum supply statistics. Petroleum supply data include field production, imports and exports, inputs and production at refineries and blending terminals, production from gas processing plants and fractionators, and inventories at refineries, terminals, pipelines, and fractionators. Crude oil inventories include Alaskan crude oil in transit by water. Aggregated Weekly Petroleum supply statistics are used for calculation of products supplied, which is an approximation of Petroleum demand.
4 The supply data contained in this Report are based primarily on company submissions for the week ending 7:00 the preceding Friday. Selected data are released electronically after 10:30 Eastern Standard Time (EST) each Wednesday. Price data presented in the WPSR include world crude oil contract prices, spot prices of crude oil and major products in major and world markets, futures prices of crude oil and major products on the New York Mercantile Exchange (NYMEX), and retail prices of gasoline and on-highway diesel fuel. During the heating season, wholesale and retail prices of propane and residential heating oil are also provided. Collectively, these price series provide a comprehensive and timely view of current and world prices of crude oil and major Petroleum products. Weekly price data are collected as of 8:00 every Monday. Weekly retail gasoline and on-highway diesel prices are first available around 5:00 EST on Monday (Tuesday when Monday is a Federal holiday).
5 Wholesale and retail propane and residential heating oil prices are released electronically after 10:30 EST each Wednesday during the heating season (October through mid-March). The daily spot and futures prices are provided by Reuters, Report is available on the World Wide Web at: Oil Production Re-benchmarking Notice: The Weekly estimates of domestic crude oil production are reviewed monthly when the Short-Term energy Outlook (STEO) is released to identify differences with recent trends in survey-based domestic production reported in the Petroleum Supply Monthly (PSM) and other current data. If a large difference between the two series is observed, the Weekly production estimate may be re-benchmarked on weeks when the STEO is released. This week s domestic crude oil production estimate incorporates a re-benchmarking that raised estimated volumes by 280,000 barrels per day, which is of this week s estimated production Petroleum Status Report / energy information AdministrationivContentsHighlights.
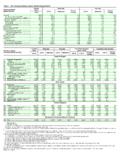
6 VTables1. Petroleum Balance Sheet, week Ending 2/2/18 ..12. Inputs and Production by PAD District ..23. Refiner and Blender Net Production ..34. Stocks of Crude Oil by PAD District, and Stocks of Petroleum Products, Totals ..45. Stocks of Total Motor Gasoline and Fuel Ethanol by PAD District ..66. Stocks of Distillate, Kerosene-Type Jet Fuel, Residual Fuel Oil, and Propane/Propylene by PAD District ..87. Imports of Crude Oil and Total Products by PAD District ..138. Preliminary Crude Imports by Country of Origin ..149. and PAD District Weekly Estimates ..1510. World Crude Oil Prices - Discontinued ..2211. Spot Prices of Crude Oil, Motor Gasoline, and Heating Oils, January 2016 to Present ..2312. Spot Prices of Ultra-Low Sulfur Diesel, Kerosene-Type Jet, Residual Fuels, and Propane, January 2016 to Present ..2513. NYMEX Futures Prices of Crude Oil, Motor Gasoline, No. 2 Heating Oil ..2614. Retail Motor Gasoline and On-Highway Diesel Fuel Prices, January 2017 to Present.
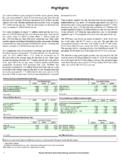
7 27 Figures1. Stocks of Crude Oil, June 2016 to Present ..52. Stocks of Total Motor Gasoline by PAD District, June 2016 to Present ..73. Stocks of Distillate Fuel Oil by PAD District, June 2016 to Present ..94. Stocks of Kerosene-Type Jet Fuel, June 2016 to Present ..105. Stocks of Residual Fuel Oil by PAD District, June 2016 to Present ..116. Stocks of Propane/Propylene by PAD District, June 2016 to Present ..127. Daily Crude Oil and Petroleum Product Spot Prices..248. Daily Trans-Atlantic Spot Product Price Differentials: New York Harbor less Rotterdam (ARA) - Discontinued ..249. Daily Futures Price Differentials: First Delivery Month Less Second Delivery Month ..2610. Average Retail Regular Motor Gasoline and On-Highway Diesel Fuel Prices ..28 Sources ..29 Appendices A. Petroleum Supply Summary Table ..31 B. Explanatory Notes ..32 C. Northeast Home Heating Oil Reserve ..46 Glossary ..55 Weekly Petroleum Status Report / energy information crude oil refinery inputs averaged million barrels per day during the week ending February 2, 2018, 784,000 barrels per day more than the previous week s average.
8 Refineries operated at of their operable capacity last week . Gasoline production increased last week , averaging million barrels per day. Distillate fuel production increased last week , averaging over million barrels per crude oil imports averaged million barrels per day last week , down by 538,000 barrels per day from the previous week . Over the last four weeks, crude oil imports averaged million barrels per day, less than the same four- week period last year. Total motor gasoline imports (including both finished gasoline and gasoline blending components) last week averaged 746,000 barrels per day. Distillate fuel imports averaged 313,000 barrels per day last week . commercial crude oil inventories (excluding those in the Strategic Petroleum Reserve) increased by million barrels from the previous week . At million barrels, crude oil inventories are in the middle of the average range for this time of year. Total motor gasoline inventories increased by million barrels last week , and are in the middle of the average range.
9 Both finished gasoline inventories and blending components inventories increased last week . Distillate fuel inventories increased by million barrels last week and are in the middle of the average range for this time of year. Propane/propylene inventories decreased by million barrels last week , but are in the middle of the average range. Total commercial Petroleum inventories increased by million barrels last week . Total products supplied over the last four- week period averaged over million barrels per day, up by from the same period last year. Over the last four weeks, motor gasoline product supplied averaged million barrels per day, up by from the same period last year. Distillate fuel product supplied averaged million barrels per day over the last four weeks, up by from the same period last year. Jet fuel product supplied is down compared to the same four- week period last WTI price was $ per barrel on February 2, 2018, $ under last week s price but $ over a year ago.
10 The spot price for conventional gasoline in the New York Harbor was $ per gallon, $ lower than last week s price but $ higher than a year ago. The spot price for No. 2 heating oil in the New York Harbor was $ per gallon, $ below last week s price but $ above a year national average retail regular gasoline price increased for the seventh week in a row to $ per gallon on February 5, 2018, $ above last week s price and $ more than a year ago. The national average retail diesel fuel price increased to $ per gallon, $ per gallon above last week and $ over a year Activity (Thousand Barrels per Day)Four Weeks Ending2/2/181/26/182/3/17 Crude Oil Input to Refineries16,54216,67416,089 Refinery Capacity Utilization (Percent) Gasoline Production9,6809,5409,171 Distillate Fuel Oil Production4,9114,9524,692 See Table (Million Barrels)2/2/181/26/182/3/171 Crude Oil (Excluding SPR) Fuel Other Oil in , , , Table data originally published for crude oil stocks included lease stocks whichbegan being excluded from commercial crude oil inventories with data for the week endedOctober 7, those domestic and Customs-cleared foreign crude oil stocks held atrefineries and tank farms or in transit thereto, and in stocks located in the "Northeast Heating Oil Reserve", "Northeast RegionalRefined Petroleum Product Reserve", and "State of New York s Strategic Fuels ReserveProgram.