Transcription of Natural Gas Monthly - Energy Information …
1 Office of Energy Production, Conversion, and Delivery Natural Gas Monthly August 2019 Department of Energy Washington, DC 20585 August 2019 Energy Information administration | Natural Gas Monthly ii This report was prepared by the Energy Information administration (EIA), the statistical and analytical agency within the Department of Energy . By law, EIA s data, analyses, and forecasts are independent of approval by any other officer or employee of the United States Government. The views in this report therefore should not be construed as representing those of the Department of Energy or other Federal agencies.
2 August 2019 Energy Information administration | Natural Gas Monthly Contacts The Natural Gas Monthly (NGM) is prepared by the Energy Information administration (EIA), Department of Energy (DOE), under the direction of the Director of the Office of Energy Production, Conversion, and Delivery, Robert Merriam. General inquiries about Energy data can be directed to EIA s Office of Communications via email at Specific questions about the Information in this report may be directed to: Consumption and Consumer Prices .. Michael Kopalek 202 586 4001) Imports and Exports .. Jose Villar 202 586 9613) Natural Gas Production.
3 Jeffrey Little 202 586 6284) Quality .. Vicki Spangler 202 586 8555) Supplemental Gaseous Fuels .. Michael Kopalek 202 586 4001) Underground Storage .. Jose Villar 202 586 9613) Other contributors to this report include Sharon Belcher, Bridgette Brown, and Gary Long. iii August 2019 Energy Information administration | Natural Gas Monthly iv Preface The Natural Gas Monthly (NGM) highlights activities, events, and analyses of interest to public and private sector organizations associated with the Natural gas industry. Volume and price data are presented each month for Natural gas production, distribution, consumption, and interstate pipeline activities.
4 Producer related activities and underground storage data are also reported. The data in this publication are collected on surveys conducted by EIA to fulfill its responsibilities for gathering and reporting Energy data. Geographic coverage is the 50 States and the District of Columbia. Explanatory Notes supplement the Information found in tables of the report. A description of the data collection surveys that support the NGM is provided in the Data Sources section. A glossary of the terms used in this report is also provided to assist readers in understanding the data presented in this publication.
5 All Natural gas volumes are reported at a pressure base of pounds per square inch absolute (psia) and at 60 degrees Fahrenheit. Cubic feet are converted to cubic meters by applying a factor of August 2019 Energy Information administration | Natural Gas Monthly v Contents Highlights .. 1 Common Abbreviations .. 2 Appendices A. Explanatory Notes .. 101 B. Data Sources .. 109 C. Statistical Considerations .. 115 Glossary .. 125 Tables 1. Summary of Natural Gas Supply and Disposition in the United States, 2014 2019.
6 3 2. Natural Gas Consumption in the United States, 2014 2019 .. 5 3. Selected National Average Natural Gas Prices, 2014 2019 .. 7 4. Natural Gas Imports, 2017 2019 .. 9 5. Natural Gas Exports, 2017 2019 .. 14 6. Gross Withdrawals of Natural Gas in Selected States and the Federal Gulf of Mexico, 2014 2019 .. 24 7. Marketed Production of Natural Gas in Selected States and the Federal Gulf of Mexico, 2014 2019 .. 26 8. Underground Natural Gas Storage All Operators, 2014 2019 .. 29 9. Underground Natural Gas Storage by Season, 2017 2019 .. 30 10.
7 Underground Natural Gas Storage Salt Cavern Storage Fields, 2014 2019 .. 31 11. Underground Natural Gas Storage Storage Fields Other than Salt Caverns, 2014 2019 .. 32 12. Net Withdrawals from Underground Storage, by State, 2017 2019 .. 33 13. Activities of Underground Natural Gas Storage Operators, by State, June 2019 .. 38 14. Natural Gas Deliveries to Residential Consumers, by State, 2017 2019 .. 39 15. Natural Gas Deliveries to Commercial Consumers, by State, 2017 2019 .. 44 16. Natural Gas Deliveries to Industrial Consumers, by State, 2017 2019 .. 49 17. Natural Gas Deliveries to Electric Power Consumers, by State, 2017 2019.
8 54 18. Natural Gas Deliveries to All Consumers, by State, 2017 2019 .. 59 19. Average Citygate Price, by State, 2017 2019 .. 64 20. Average Price of Natural Gas Sold to Residential Consumers, by State, 2017 2019 .. 69 21. Average Price of Natural Gas Sold to Commercial Consumers, by State, 2017 2019 .. 74 22. Average Price of Natural Gas Sold to Industrial Consumers, by State, 2017 2019 .. 79 23. Average Price of Natural Gas Sold to Electric Power Consumers, by State, 2017 2019 .. 84 24. Percentage of Total Deliveries Included in Residential, Commercial, and Industrial Prices, by State, 2017 2019.
9 89 25. Heating Value of Natural Gas Consumed, by State, 2017 2019 .. 96 A1. Methodology for Most Recent Monthly Natural Gas Supply and Disposition Data of Tables 1 and 2 .. 101 C1. Standard Error for Natural Gas Deliveries and Price to Consumers by State, June 2019 .. 123 August 2019 Energy Information administration | Natural Gas Monthly iv Figures 1. Production, Consumption, and Net Imports of Natural Gas in the United States, 2016 2019 .. 4 2. Natural Gas Deliveries to Consumers in the United States, 2016 2019 .. 6 3. Citygate and Consumer Prices of Natural Gas in the United States, 2016 2019.
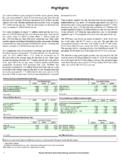
10 8 4. Spot Prices of Natural Gas and Natural Gas Plant Liquids in the United States, 2016 2019 .. 8 5. Working Gas in Underground Natural Gas Storage in the United States, 2016 2019 .. 29 6. Percentage of Total Deliveries Included in Residential, Commercial, and Industrial Price Estimates, 2016 2019 .. 95 vi August 2019 Energy Information administration | Natural Gas Monthly 1 Highlights This issue of the Natural Gas Monthly (NGM) contains state and national level estimates of Natural gas volume and price data through June 2019. Recent analyses of the Natural gas industry are available on the EIA website by clicking the Natural Gas link under the Sources & Uses tab.