Transcription of Near-Single Sideband Modulation in Strong Optical ...
1 < < strong >Strongstrong > >Near-Singlestrong >Strongstrong > > < < strong >Strongstrong > >Sidebandstrong >Strongstrong > > < < strong >Strongstrong > >Modulationstrong >Strongstrong > > in < strong >Strongstrong > < < strong >Strongstrong > >Opticalstrong >Strongstrong > > < strong >injectionstrong > - < strong >lockedstrong > Semiconductor Lasers Hyuk-Kee Sung, Erwin K. Lau and Ming C. Wu Department of Electrical Engineering and Computer Sciences, 253M Cory Hall, University of California, Berkeley, CA 94720, USA Tel: +1-510-643-0808. Fax: +1-510-643-6637. Email: Abstract: Asymmetric < < strong >Strongstrong > >Modulationstrong >Strongstrong > > sidebands have been demonstrated by controlling frequency detuning of < strong >Strongstrong > < < strong >Strongstrong > >Opticalstrong >Strongstrong > > < strong >injectionstrong > - < strong >lockedstrong > semiconductor lasers. < < strong >Strongstrong > >Near-Singlestrong >Strongstrong > > < < strong >Strongstrong > >Sidebandstrong >Strongstrong > > generated by the technique significantly reduces fiber chromatic-dispersion effect with enhanced < < strong >Strongstrong > >Modulationstrong >Strongstrong > > bandwidth.
2 2005 < < strong >Strongstrong > >Opticalstrong >Strongstrong > > Society of America OCIS codes: ( ) Lasers, < strong >injectionstrong > - < strong >lockedstrong > ; ( ) Fiber optics communications. Introduction Directly modulated semiconductor lasers are simple and low-cost sources for transmitting RF signals over < < strong >Strongstrong > >Opticalstrong >Strongstrong > > fibers. Standard < < strong >Strongstrong > >Modulationstrong >Strongstrong > > generates two signal sidebands on both sides of the < < strong >Strongstrong > >Opticalstrong >Strongstrong > > carrier. The dispersion in fibers causes a walk-off in the phases of the sidebands, resulting in degradation of the recovered RF signals [1]. This imposes a limit on the product of RF carrier frequency and fiber transmission distance.
3 The < strong >laserstrong > chirp, or frequency < < strong >Strongstrong > >Modulationstrong >Strongstrong > > (FM) accompanying the intensity < < strong >Strongstrong > >Modulationstrong >Strongstrong > > (IM), further complicates the dispersion effect [2]. Single < < strong >Strongstrong > >Sidebandstrong >Strongstrong > > < < strong >Strongstrong > >Modulationstrong >Strongstrong > > can alleviate the dispersion penalty; however, it requires sophisticated external modulators [1]. < < strong >Strongstrong > >Sidebandstrong >Strongstrong > > filtering using fiber grating has also been reported [3], however, it requires precise matching of wavelengths. In this paper, we report on a novel < < strong >Strongstrong > >Near-Singlestrong >Strongstrong > > < < strong >Strongstrong > >Sidebandstrong >Strongstrong > > < < strong >Strongstrong > >Modulationstrong >Strongstrong > > technique for semiconductor lasers using < strong >Strongstrong > < < strong >Strongstrong > >Opticalstrong >Strongstrong > > < strong >injectionstrong > locking. Under some locking condition, we found that, in addition to enhancement of resonant frequency and reduction of chirp, the upper < < strong >Strongstrong > >Sidebandstrong >Strongstrong > > is enhanced while the lower < < strong >Strongstrong > >Sidebandstrong >Strongstrong > > is suppressed, resulting in a 12-dB asymmetry under 20-GHz RF < < strong >Strongstrong > >Modulationstrong >Strongstrong > > .
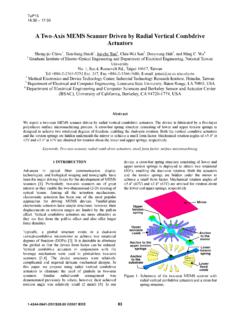
4 The amount of the asymmetry can be controlled by the frequency detuning between the master and the free-running slave lasers. We have measured the RF performance of the free-running and < strong >injectionstrong > < strong >lockedstrong > link over 80-km fibers. The dispersion-limited RF bandwidth has been greatly increased by maintaining the variation of fiber transmission response to within 7 dB up to 20-GHz RF carrier frequency. Experiment setup Figure 1 shows the experimental setup. A tunable < strong >laserstrong > with external cavity is used as the master < strong >laserstrong > . Its output is amplified by an erbium-doped fiber amplifier (EDFA) to achieve < strong >Strongstrong > < strong >injectionstrong > locking.
5 An inline power meter/attenuator is used to control the < strong >injectionstrong > ratio. An < < strong >Strongstrong > >Opticalstrong >Strongstrong > > circulator with >40 dB isolation prevents light Master + IRFOSARF-SANetwork Analyzer80 kmEDFAS lave LaserPCInjection Locking3 dB couplerEDFAP hotodetector3-portcirculator Fig. 1. Experimental setup: EDFA: erbium-doped fiber amplifier. Attn.: variable < < strong >Strongstrong > >Opticalstrong >Strongstrong > > attenuator. PC: polarization controller. OSA: < < strong >Strongstrong > >Opticalstrong >Strongstrong > > spectrum analyzer. RF-SA: RF spectrum analyzer. 1230 2006 OSA/OFC 2006coupling from the slave < strong >laserstrong > back to the master < strong >laserstrong > . The circulator also protects the slave < strong >laserstrong > against back-reflected light.
6 A two-section DFB < strong >laserstrong > with bent waveguide [4] is used as the slave < strong >laserstrong > . In this experiment, only the section facing the circulator is biased and modulated. The output from the slave < strong >laserstrong > is monitored by an < < strong >Strongstrong > >Opticalstrong >Strongstrong > > spectrum analyzer with nm resolution. A high-speed photodetector (~ 34 GHz) converts the < < strong >Strongstrong > >Opticalstrong >Strongstrong > > signal to electrical signal. An RF spectrum analyzer and network analyzer are used to characterize the RF performance. An 80-km < < strong >Strongstrong > >Opticalstrong >Strongstrong > > fiber with negative dispersion (Corning MetroCor, D ~ -8 ps/km/nm) is used for transmission experiments.
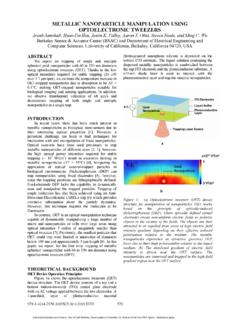
7 To compensate for the loss of the fiber link, the transmitted signal is amplified by an EDFA. Asymmetric < < strong >Strongstrong > >Modulationstrong >Strongstrong > > sidebands under < < strong >Strongstrong > >Opticalstrong >Strongstrong > > < strong >injectionstrong > locking Figure 2 shows the measured < < strong >Strongstrong > >Opticalstrong >Strongstrong > > spectra of the RF-modulated slave < strong >laserstrong > (frequency frf = 20 GHz) under (a) free-running, and < strong >injectionstrong > locking with (b) GHz and (c) -38 GHz detuning conditions. The frequency detuning, f, is defined as the frequency difference between the free-running slave < strong >laserstrong > and the master < strong >laserstrong > ( f = fmaster fslave). The slave < strong >laserstrong > is biased at mA (= ). To achieve < strong >Strongstrong > < < strong >Strongstrong > >Opticalstrong >Strongstrong > > < strong >injectionstrong > locking, the output power from the EDFA following the master < strong >laserstrong > is set to 8 dBm ( < strong >injectionstrong > ratio R ~ 11 dB).
8 As shown in Fig. 2(a), the modulated sidebands are symmetric in free-running condition. Under < strong >Strongstrong > < < strong >Strongstrong > >Opticalstrong >Strongstrong > > < strong >injectionstrong > locking, the < < strong >Strongstrong > >Modulationstrong >Strongstrong > > sidebands become asymmetric and the asymmetry varies with f. As shown in Fig. 2(b), the asymmetry is maximized when f is set at GHz. Figure 3 shows the corresponding frequency responses. The relaxation oscillation frequency of the free-running < strong >laserstrong > is ~ 3 GHz. When the < strong >laserstrong > is < strong >injectionstrong > - < strong >lockedstrong > , the original relaxation oscillation of the < strong >laserstrong > is damped, and the enhancement or damping of the new resonance frequency is observed.
9 For f = - GHz, the < strong >injectionstrong > - < strong >lockedstrong > < strong >laserstrong > shows the enhanced resonance frequency (> 20 GHz) beyond the measurable range of our equipment. For the < strong >injectionstrong > locking condition of f = - 38 GHz, the < strong >injectionstrong > - < strong >lockedstrong > < strong >laserstrong > shows highly-damped frequency response. The phenomena are explained by the cavity resonance effect [5]. The asymmetry between the < < strong >Strongstrong > >Modulationstrong >Strongstrong > > sidebands are also related to the cavity resonance effect. As shown in Fig. 4, the power difference between upper and lower < < strong >Strongstrong > >Modulationstrong >Strongstrong > > sidebands (frf = 20 GHz) depends on f. Maximum asymmetry occurs at small positive detuning frequency (12 dB at f = GHz) < < strong >Strongstrong > >Opticalstrong >Strongstrong > > Power (dBm)Wavelength (nm) Wavelength (nm) f = - GHz12 dBWavelength (nm) f = - 38 GHz (a) (b) (c) Fig.
10 2. Measured < < strong >Strongstrong > >Opticalstrong >Strongstrong > > spectra of RF-modulated slave < strong >laserstrong > (frf = 20 GHz) under various conditions: (a) free-running; (b) < strong >injectionstrong > -locking with f = GHz; and (c) < strong >injectionstrong > -locking with f = -38 GHz. 05101520-80-60-40-20 Relative Response (dB) < < strong >Strongstrong > >Modulationstrong >Strongstrong > > frequency (GHz)free-running 05101520-80-60-40-20 < < strong >Strongstrong > >Modulationstrong >Strongstrong > > frequency (GHz) f = - GHz05101520-80-60-40-20 < < strong >Strongstrong > >Modulationstrong >Strongstrong > > frequency (GHz) f = -38 GHz (a) (b) (c) Fig. 3. Measured frequency response of the slave < strong >laserstrong > under various conditions: (a) free-running; (b) < strong >injectionstrong > -locking with f = GHz; and (c) < strong >injectionstrong > -locking with f = -38 GHz.