Transcription of nginEEring by thE numbErs - American Society for ...
1 EnginEEring by thE numbErsBy Brian L. Yoder, bachElor s DEgrEEs anD EnrollmEntDegrees awarded to students graduating with a bachelor s degree from an engineering program increased by percent from 2014 to 2015, continuing a trend of annual growth since 2007. Some of the largest year-to-year per-centage increases were seen in computer engineering-related programs: Computer Engineering, percent; Computer Science (inside engineering), percent; and Electrical/Computer Engineering, percent. Electrical Engineering was an outlier, showing only a percent gain in bachelor s degrees over the previous enrollment in undergraduate engineering pro-grams increased by percent over 2014, continuing a growth trend evident since 2005. The largest gains were in Computer Science (inside engineering), percent, and Engineering Management, percent. Only two programs saw a decrease in enrollment at the bach-elor s degree level: Engineering (General), which fell by percent, and Mining Engineering, which saw a percent s DEgrEEs anD EnrollmEntMaster s degrees awarded in 2015 increased by per-cent over 2014.
2 Similar to the trend in bachelor s degrees, computer engineering-related programs saw some of the largest percentage increases at the Master s level: Computer Science (inside engineering) rose by per-cent, Electrical Engineering by percent; and Electrical/Computer Engineering by percent. Engineering programs related to extraction of resources also saw large gains in Master s degrees between 2014 and 2015, with Mining Engineering showing a percent gain and Petroleum Engineering growing by in engineering Master s degree programs increased by percent from 2014 to 2015. Chemical Engineering saw the largest increase: percent. Architectural Engineering enrollment showed the big-gest drop: percent. Doctoral DEgrEEs anD EnrollmEntEngineering Doctoral degrees increased by percent over 2014. The largest percentage gains were seen in Computer Engineering, Mining Engineering, and Engineering Management, which saw percent, percent, and percent gains over 2014, respectively.
3 Meanwhile, enrollment in engineering doctoral programs increased by percent, with Engineering Management showing the biggest gain: percent. The largest decrease was in Environmental Engineering, which fell by percent. EnginEEring stuDEnts from othEr countriEsStudents from outside the United States earned approxi-mately the same percentage of Engineering degrees as in 2014, but their enrollment increased at all degree levels. The percentage of Bachelor s degrees increased slightly, to percent, while undergraduate enrolment increased a full percentage point, to percent. The percentage of Master s degrees decreased slightly to percent, but enrollment increased to percent. The percentage of Doctoral degrees awarded to international students fell slightly in 2015 to percent, while enrolment was up about 2 percent to EnginEEring stuDEntsContinuing a trend of the past several years, women represented a larger percentage of Master s and Doctoral students in 2015 than the year before.
4 They also earned a larger share of graduate than of Bachelor s degrees. Females were awarded percent of all Bachelor s degrees awarded by an engineering program in 2015 and made up percent of undergraduates enrolled in engineering. They received percent of Master s degrees and percent of doctoral degrees in 2015. Women represented percent of students studying for a Master s degree in 2015 and percent of those pursuing a doctorate. faculty The number of tenured and tenure-track faculty increased from the prior year to 26,839. The number of full professors reached 13,111 as of the fall of 2014, only slightly less than the combined total of associate and assistant professors 7,459 and 6,269, respectively. Women increased their representation in faculty ranks to percent, a more than 4 percent gain since 2006. African Americans stayed at the same percentage as last year, percent, having gained only a percent share since 2006.
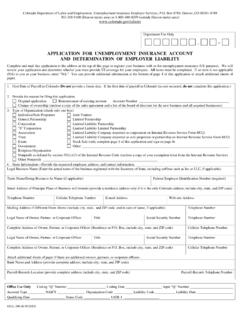
5 Hispanics also stayed at the same percentage as last year, percent, a percent gain since 2006. The proportion of Asians grew to percent of all engineering faculty in detailed data for 368 and 9 Canadian engineer-ing colleges can be found in the following pages of the 2015 Profiles of Engineering and Engineering Technology Colleges or online at Yoder is director of assessment, evaluation and insti-tutional research at the American Society for Engineering Education. He can be contracted at For more information, visit the ASEE Web site at the NumbersMechanicalElectricalComputer Sci. (Inside Eng.)Computer Sci. (Outside Eng.)CivilBiomedicalElectrical/ComputerC hemicalIndustrial/Manufacturing/SystemsO therAerospaceComputerEngineering (General)Metallurgical & MaterialsArchitecturalBiological & AgriculturalEnvironmentalEng. Science & Eng. PhysicsEngineering ManagementCivil/EnvironmentalPetroleumNu clearMining25,43611,90011,38510,9709,090 4,5175,2915,6833,803 4,8813,4291,6711,3941,465 1,000 5681,1241,100545 544527335 4,66705,00010,00015,00020,00025,000 Bachelor s Degrees awarDeD By engineering Discipline: 106,658* percentage of Bachelor s Degrees awarDeD to women By Discipline: of totalBachelor s Degrees, 2014 2015*Total does not include computer science (outside engineering).
6 MechanicalElectricalComputer Sci. (Inside Eng.)ChemicalBiomedicalComputer Sci. (Outside Eng.) % & %Eng. Science & Eng. & (General) For more information, visit the ASEE Web site at the Numbersengineering Bachelor s Degrees awarDeD By school1. Univ. of Illinois, Urbana-Champaign 2,012 2. Georgia Institute of Technology 1,985 3. Virginia Tech 1,666 4. Purdue University 1,626 5. The Pennsylvania State University 1,624 6. Texas A&M University 1,490 7. Ohio State University 1,483 8. University of Michigan 1,463 9. North Carolina State University 1,347 10. University of California, Berkeley 1,243 11. University of Central Florida 1,239 12. University of Florida 1,217 13. University of California, San Diego 1,198 14. Iowa State University 1,155 15. University of Texas, Austin 1,135 16. Arizona State University 1,123 17. California Polytechnic State University 1,072 18. Missouri Univ. of Science and Tech. 99519. University of Washington 96920.
7 colorado School of Mines 91721. Oregon State University 91622. University of Minnesota,Twin Cities 90523. University of Maryland, college Park 88724. Clemson University 82225. Cornell University 82026. University of Wisconsin, Madison 81327. California State Poly. U., Pomona 80728. Rutgers University 79029. University at Buffalo, SUNY 78230. Massachusetts Institute of Technology 76431. Florida International University 75831. Louisiana State University 75833. Drexel University 75334. University of California, Los Angeles 74835. Auburn University 74536. University of colorado , Boulder 74137. Stony Brook University 73838. University of California, Davis 70939. Washington State University 70340. Texas Tech University 67641. Rensselaer Polytechnic Institute 67042. Michigan Technological University 65442. University of Virginia 65444. West Virginia University 64945. Worcester Polytechnic Institute 64746. University of California, Irvine 64647. California State University, Long Beach 64148.
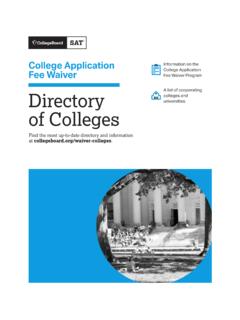
8 Michigan State University 63249. University of Missouri 59650. Stanford University 593 Bachelor s Degrees By ethnicity, 2015*Bachelor s Degrees By resiDency, 2015 Bachelor s Degrees By genDer, 2015352 schools reported.** American Indians ( ), Hawaiian/Pacific Islanders ( ) and Two or More ( ) are combined under Bachelor s Degrees, 2006 2015 2006 2007 2008 2009 2010 2011 2012 2013 2014 Black or African- American American 2006 2007 2008 2009 2010 2011 2012 2013 2014 Nonresident Alien Resident or Resident 2006 2007 2008 2009 2010 2011 2012 2013 2014 Female
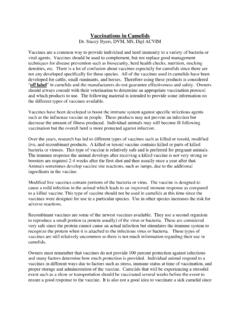
9 For more information, visit the ASEE Web site at the NumbersNonresident AlienHispanicHawaiin/Pac. IslanderFemaleMaleUnknownAmerican IndianAsian AmericanBlack or Afr. AmericanWhiteTwo or MoreTotal7,5902,1173,0237288,1452,225292 959,9053,1062,927 9372006551,51611,3931,78560985,38321,275 7302,0004,0006,0008,00010,000 Bachelor s Degrees awarDeD By ethnicity anD genDer: 106,658* Nonresident AlienHispanicHawaiin/Pac. IslanderFemaleMaleUnknownAmerican IndianAsian AmericanWhiteTwo or MoreTotal48,17211,87316,4754,43153,30015 ,3661,74753254,29619,05020,8667,15583223 4270,13867,36413,8684,762479,694130,767 Black or Afr. American05,00010,00015,00020,00025,000*I ncludes 702 male and 270 female graduates from schools in Puerto Rico. engineering Bachelor s enrollment anD DegreesUnDergraDUate enrollment By ethnicity anD genDer: 610,461*15 For more information, visit the ASEE Web site at the NumbersBachelor s Degrees awarDeD to women By school1. Georgia Institute of Technology 5172.
10 Massachusetts Institute of Technology 3493. University of Michigan 3424. Purdue University 3385. Univ. of Illinois, Urbana-Champaign 3296. Ohio State University 3107. Pennsylvania State University 3028. University of Florida 2889. Texas A&M University 28610. Cornell University 27911. Virginia Tech 27812. University of California, San Diego 27513. University of California, Berkeley 26614. colorado School of Mines 25615. University of Texas, Austin 25316. University of Washington 23817. North Carolina State University 22718. California Polytechnic State University 22219. University of Virginia 20520. Missouri Univ. of Science and Tech. 19120. Worcester Polytechnic Institute 19122. University of Maryland, college Park 18423. Clemson University 18324. Arizona State University 17924. University of Central Florida 17926. Drexel University 17727. Columbia University 17327. University of Puerto Rico, Mayaguez 17329. Rensselaer Polytechnic Institute 17130. University of colorado , Boulder 16831.