Transcription of Non-financial census of municipalities for the year …
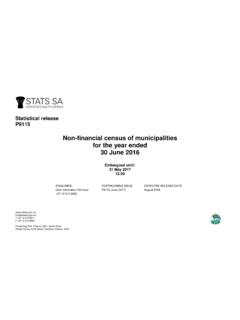
1 Statistical release P9115. Non-financial census of municipalities for the year ended 30 June 2015. Embargoed until: 07 June 2016. 11:00. Enquiries: Forthcoming issue: Expected release date User Information Services P9115 June 2016 August 2017. +27 12 310 8600. Statistics South Africa i P9115. PREFACE. Statistics South Africa (Stats SA) has undertaken an annual Non-financial census of municipalities with effect from 2002. The purpose of the census is to measure selected aspects of service delivery of municipalities . The results of this census provide information that can serve as a framework for policymakers and other stakeholders for planning and monitoring. The census enables users to analyse the services provided by municipalities in terms of water, electricity, solid waste management, sewerage and sanitation. The 2015 Non-financial census of municipalities obtained information on various issues, including: particulars of services provided in the municipalities as at 30 June 2014 and 30 June 2015; and particulars of total employment in the municipalities as at 30 June 2014 and 30 June 2015.
2 This statistical release contains the preliminary results of the 2015 Non-financial census of municipalities and the revised figures for 2014. In the event of revised figures being obtained for 2015, they will be incorporated into the 2016 Non-financial census of municipalities (if applicable). For the purposes of this printed version, all results are presented at provincial level. Unit data for all municipalities (2014 and 2015) can be obtained from the Stats SA. website (or can be made available upon request). PJ Lehohla Statistician-General Non-financial census of municipalities for the year ended 30 June 2015. Statistics South Africa ii P9115. Contents Background .. iv Purpose of the survey .. iv Methodology .. iv Technical notes .. v List of municipalities (2015) .. vi Key findings .. 1. Table - Managerial positions by province according to Section 57 of Local Government Municipal System Act, 2000 (Act of 2000): 2014 and 2015.
3 8. Table - Managerial positions by province according to organogram: 2014 and 2015 .. 9. Table Number of councillors by province: 2014 and 2015 .. 10. Table - Executive mayor and mayor positions by province: 2014 and 2015 .. 11. Table - Employment positions including managerial positions by province: 2014 and 2015 .. 12. Table - Employment positions excluding managerial positions by department for 2014 and 2015: .. 13. Table 3 - Number of municipalities in each province responsible for providing services under the powers and functions allocated to them: 2014 and 2015 .. 14. Table 4 - Number of municipalities in each province with infrastructure to provide services: 2014 and 2015 .. 15. Table 5 - Number of municipalities in each province that provide basic services: 2014 and 2015 .. 16. Table 6 - Number of municipalities in each province that have commercialised or outsourced basic services: 2014 and 2015.
4 17. Table 7 - Number of consumer units in each province receiving selected services from municipalities : 2014 and 2015 .. 18. Table 8 - Number of consumer units in each province receiving water from municipalities : 2014 and 2015 .. 19. Table 9 - Number of consumer units in each province receiving basic sewerage and sanitation from municipalities : 2014 and 2015 .. 20. Table 10 - Number of municipalities in each province with a policy in place relating to free basic services: 2014 and 2015 .. 21. Non-financial census of municipalities for the year ended 30 June 2015. Statistics South Africa iii P9115. Table 11 - Number of municipalities in each province which have implemented the policy relating to free basic services: 2014 and 2015 .. 22. Table 12 - Number of municipalities in each province providing free basic services at standard and other levels: 2014 and 2015 .. 23. Table 13 - Number of domestic consumer units in each province receiving free basic services from municipalities : 2014 and 2015.
5 24. Table (a) - Mechanisms used by municipalities to provide free basic services to indigent households for 2015: Water .. 25. Table (b) - Mechanisms used by municipalities to provide free basic services to indigent households for 2015: Electricity .. 26. Table (c) - Mechanisms used by municipalities to provide free basic services to indigent households for 2015: Sewerage and sanitation .. 27. Table (d) - Mechanisms used by municipalities to provide free basic services to indigent households for 2015: Solid waste management .. 28. Table - Number of municipalities in each province using indicated monthly income cut-off points to identify indigent households: 2015 .. 29. Table 15 - Number of municipalities in each province with an indigent support policy: 2014 and 2015 .. 30. Table 16 - Number of municipalities in each province which have implemented an indigent support policy: 2014 and 2015.
6 31. Table 17 - Number of indigent households in each province benefiting from an indigent support system over the period 2014 and 2015 .. 32. Table 18 - Number of municipalities in each province that provide free basic alternative energy: 2014 and 2015 .. 33. Table 19 - Number of indigent households in each province provided with free basic alternative energy: 2014 and 2015 .. 34. Table 20 - Number of municipalities in each province that have submitted an Integrated Development Plan (IDP), WSDP, monitoring for water quality and effluent discharges, and an HIV/AIDS policy, and signed a funding agreement with Eskom: 2014 and 2015 .. 35. Explanatory notes .. 36. Glossary of the selected variables .. 37. Technical enquiries .. 39. General information .. 40. Non-financial census of municipalities for the year ended 30 June 2015. Statistics South Africa iv P9115. Background Methodology The census provides information that serves as a framework for policymakers and Scope of the survey other stakeholders for analysis, planning and monitoring in terms of service delivery of water, electricity, solid waste management, sewerage and sanitation.
7 All 278 municipalities responded to the survey for 2015. Purpose of the survey Questionnaire and data collection This publication is directed towards the following major goals: The methods used for collection included personal visits, telephone, fax, email and post. Data are generally comparable between the 2014 and 2015. Assist in monitoring the progress made with regard to the implementation publications. of service provision, free basic services and poverty alleviation as national priorities. Limitations of the survey Provide baseline Non-financial information from those institutions classified as municipalities in terms of the Local Government Municipal This publication is not necessarily comparable with the Stats SA population Structures Act, 1998 (Act No. 117 of 1998). census of 2011 and/or household survey data, mainly due to: Provide information that can serve as a framework for policymakers and i.
8 The data source is municipalities as opposed to households. other stakeholders for planning, as well as monitoring and evaluating the ii. The different definitions of household'. Most municipalities do not performance of municipalities . have a system for identifying multiple households served by one Allow national and provincial governments and other stakeholders to billing unit or delivery point. analyse the actual services provided by municipalities . iii. Different reporting periods. Make data available for use by researchers, organisations and individuals. The term consumer unit' or billing unit' (as used by the municipality for their recording purposes) is not directly comparable with other Stats SA. household-based surveys. Non-financial census of municipalities for the year ended 30 June 2015. Statistics South Africa v P9115. Technical notes Collection rates for the 2015 financial year per province municipalities Province Metropolitan Districts Local Total Collection rate municipalities municipalities municipalities Western Cape 1 5 24 30 100%.
9 Eastern Cape 2 6 37 45 100%. Northern Cape 0 5 27 32 100%. Free State 1 4 19 24 100%. KwaZulu-Natal 1 10 50 61 100%. North West 0 4 19 23 100%. Gauteng 3 2 7 12 100%. Mpumalanga 0 3 18 21 100%. Limpopo 0 5 25 30 100%. Total 8 44 226 278 100%. Non-financial census of municipalities for the year ended 30 June 2015. Statistics South Africa vi P9115. List of municipalities (2015) Eastern Cape Northern Cape Western Cape Nelson Mandela Bay Metro Alfred Nzo District Municipality Namakwa District Municipality Matatiele Richtersveld City of Cape Town Metro Buffalo City Metro Umzimvubu Nama Khoi Ntabankulu Kamiesberg West Coast District Municipality Sarah Baartman District Mbizana Hantam Matzikama Municipality (was Cacadu) Karoo Hoogland Cederberg Camdeboo Khai-Ma Bergrivier Blue Crane Route Tambo District Municipality Saldanha Bay Ikwezi Ngquza Hill Pixley kaSeme District Swartland Makana Port St Johns Municipality Ndlambe Nyandeni Ubuntu Cape Winelands District Sunday's River Valley Mhlontlo Umsobomvu Municipality Baviaans King Sabata Dalindyebo Emthanjeni Witzenberg Kouga Kareeberg Drakenstein Kou-Kamma Joe Gqabi District Municipality Renosterberg Stellenbosch Elundini Thembelihle Breede Valley Amathole District Municipality Gariep Siyathemba Langeberg Mbhashe Maletswai Siyancuma Mnquma Senqu Great Kei ZF Mgcawu District Municipality Overberg District Municipality Amahlathi Mier Theewaterskloof Ngqushwa !
10 Kai !Garib Overstrand Nkonkobe //Khara Hais Cape Agulhas Nxuba !Kheis Swellendam Tsantsabane Chris Hani District Municipality Kgatelopele Eden District Municipality Kannaland Inxuba Yethemba John Taolo Gaetsewe District Hessequa Tsolwana Municipality Mossel Bay Inkwanca Ga-Segonyana George Lukhanji Gamagara Oudtshoorn Intsika Yethu Joe Morolong Bitou Emalahleni Knysna Engcobo Frances Baard District Sakhisizwe Municipality Central Karoo District Dikgatlong Municipality Magareng Laingsburg Phokwane Prince Albert Sol Plaatje Beaufort West Non-financial census of municipalities for the year ended 30 June 2015. Statistics South Africa vii P9115. Free State KwaZulu-Natal KwaZulu-Natal (concluded) North West Mangaung Metro eThekwini Metro Zululand District Municipality Bojanala District Municipality eDumbe Moretele Xhariep District Municipality Ugu District Municipality uPhongolo Madibeng Letsemeng Vulamehlo Abaqulusi Rustenburg Kopanong Umdoni Nongoma Kgetlengrivier Mohokare Umzumbe Ulundi Moses Kotane Naledi uMuziwabantu Ezinqolweni uMkhanyakude District Ngaka Modiri Molema District Lejweleputswa District Hibiscus Coast Municipality Municipality Municipality uMhlabuyalingana Ratlou Masilonyana uMgungundlovu District Jozini Tswaing Tokologo Municipality The Big Five False Bay Mahikeng Tswelopele uMshwathi Hlabisa Ditsobotla Matjhabeng uMngeni Mtubatuba Ramotshere Moila Nala Mooi Mpofana Impendle uThungulu District Municipality Dr Ruth Segomotsi Mompati Thabo Mofutsanyane District Msunduzi Mfolozi District Municipality Municipality Mkhambathini City of uMhlathuze Kagisano-Molopo
