Transcription of Note: The following table appears in the printed …
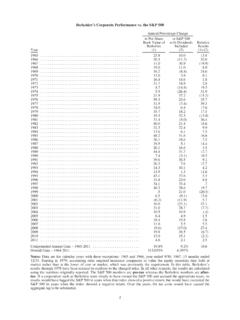
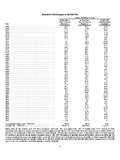
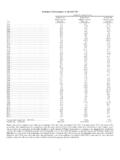
1 Note: The following table appears in the printed Annual Report on the facing page of the Chairman's Letter and is referred to in that letter. 2 Berkshire s Corporate Performance vs. the S&P 500 Annual Percentage Change in Per-Share in S&P 500 Book Value of with Dividends Relative Berkshire Included Results Year (1) (2) (1)-(2) 1965 .. 1966 .. ( ) 1967 .. ( ) 1968 .. 1969 .. ( ) 1970.
2 1971 .. 1972 .. 1973 .. ( ) 1974 .. ( ) 1975 .. ( ) 1976 .. 1977 .. ( ) 1978 .. 1979.
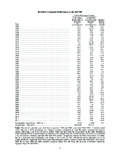
3 1980 .. ( ) 1981 .. ( ) 1982 .. 1983 .. 1984 .. 1985 .. 1986 .. 1987 .. 1988.
4 1989 .. 1990 .. ( ) 1991 .. 1992 .. 1993 .. 1994 .. 1995 .. 1996 .. 1997.
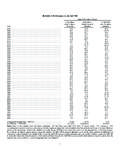
5 7 1998 .. 1999 ..5 ( ) 2000 .. ( ) 2001 .. ( ) ( ) 2002 .. ( ) 2003 .. ( ) 2004 .. (.4) 2005 .. 2006 .. 2007.
6 Compounded Annual Gain 1965-2007 Overall Gain 1964-2007 400,863% 6,840% Notes: Data are for calendar years with these exceptions: 1965 and 1966, year ended 9/30; 1967, 15 months ended 12/31. Starting in 1979, accounting rules required insurance companies to value the equity securities they hold at market rather than at the lower of cost or market, which was previously the requirement. In this table , Berkshire s results through 1978 have been restated to conform to the changed rules. In all other respects, the results are calculated using the numbers originally reported. The S&P 500 numbers are pre-tax whereas the Berkshire numbers are after-tax. If a corporation such as Berkshire were simply to have owned the S&P 500 and accrued the appropriate taxes, its results would have lagged the S&P 500 in years when that index showed a positive return, but would have exceeded the S&P 500 in years when the index showed a negative return.
7 Over the years, the tax costs would have caused the aggregate lag to be substantial. BERKSHIRE HATHAWAY INC. To the Shareholders of Berkshire Hathaway Inc.: Our gain in net worth during 2007 was $ billion, which increased the per-share book value of both our Class A and Class B stock by 11%. Over the last 43 years (that is, since present management took over) book value has grown from $19 to $78,008, a rate of compounded annually.* Overall, our 76 operating businesses did well last year. The few that had problems were primarily those linked to housing, among them our brick, carpet and real estate brokerage operations. Their setbacks are minor and temporary. Our competitive position in these businesses remains strong, and we have first-class CEOs who run them right, in good times or bad. Some major financial institutions have, however, experienced staggering problems because they engaged in the weakened lending practices I described in last year s letter.
8 John Stumpf, CEO of Wells Fargo, aptly dissected the recent behavior of many lenders: It is interesting that the industry has invented new ways to lose money when the old ways seemed to work just fine. You may recall a 2003 Silicon Valley bumper sticker that implored, Please, God, Just One More Bubble. Unfortunately, this wish was promptly granted, as just about all Americans came to believe that house prices would forever rise. That conviction made a borrower s income and cash equity seem unimportant to lenders, who shoveled out money, confident that HPA house price appreciation would cure all problems. Today, our country is experiencing widespread pain because of that erroneous belief. As house prices fall, a huge amount of financial folly is being exposed. You only learn who has been swimming naked when the tide goes out and what we are witnessing at some of our largest financial institutions is an ugly sight.
9 Turning to happier thoughts, we can report that Berkshire s newest acquisitions of size, TTI and Iscar, led by their CEOs, Paul Andrews and Jacob Harpaz respectively, performed magnificently in 2007. Iscar is as impressive a manufacturing operation as I ve seen, a view I reported last year and that was confirmed by a visit I made in the fall to its extraordinary plant in Korea. Finally, our insurance business the cornerstone of Berkshire had an excellent year. Part of the reason is that we have the best collection of insurance managers in the business more about them later. But we also were very lucky in 2007, the second year in a row free of major insured catastrophes. That party is over. It s a certainty that insurance-industry profit margins, including ours, will fall significantly in 2008. Prices are down, and exposures inexorably rise.
10 Even if the has its third consecutive catastrophe-light year, industry profit margins will probably shrink by four percentage points or so. If the winds roar or the earth trembles, results could be far worse. So be prepared for lower insurance earnings during the next few years. Yardsticks Berkshire has two major areas of value. The first is our investments: stocks, bonds and cash equivalents. At yearend these totaled $141 billion (not counting those in our finance or utility operations, which we assign to our second bucket of value). *All per-share figures used in this report apply to Berkshire s A shares. Figures for the B shares are 1/30th of those shown for the A. 3 Insurance float money we temporarily hold in our insurance operations that does not belong to us funds $59 billion of our investments.