Transcription of Note: The following table appears in the printed Annual ...
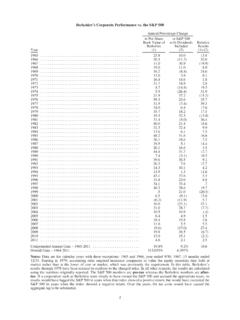
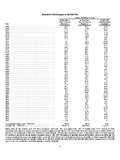
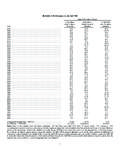
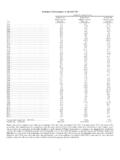
1 Note: The following table appears in the printed Annual Report on the facing page of the Chairman's letter and is referred to in that letter . Berkshire's Corporate Performance vs. the S&P 500. Annual Percentage Change in Per-Share in S&P 500. Book Value of with Dividends Relative Berkshire Included Results Year (1) (2) (1)-(2). 1965 .. 1966 .. ( ) 1967 .. ( ). 1968 .. 1969 .. ( ) 1970 .. 1971 .. 1972 .. 1973 .. ( ) 1974 .. ( ) 1975 .. ( ). 1976 .. 1977 .. ( ) 1978 .. 1979 .. 1980 .. ( ). 1981 .. ( ) 1982 .. 1983 .. 1984 .. 1985 .. 1986 .. 1987 .. 1988 .. 1989 .. 1990 .. ( ) 1991 .. 1992 .. 1993 .. 1994 .. 1995 .. 1996 .. 1997 ..7. 1998 .. 1999 ..5 ( ). 2000 .. ( ) 2001 .. ( ) ( ) 2002 .. ( ) 2003 .. ( ). 2004 .. (.4). Average Annual Gain 1965-2004 Overall Gain 1964-2004 286,865 5,318. Notes: Data are for calendar years with these exceptions: 1965 and 1966, year ended 9/30; 1967, 15 months ended 12/31. Starting in 1979, accounting rules required insurance companies to value the equity securities they hold at market rather than at the lower of cost or market, which was previously the requirement.
2 In this table , Berkshire's results through 1978 have been restated to conform to the changed rules. In all other respects, the results are calculated using the numbers originally reported. The S&P 500 numbers are pre-tax whereas the Berkshire numbers are after-tax. If a corporation such as Berkshire were simply to have owned the S&P 500 and accrued the appropriate taxes, its results would have lagged the S&P 500. in years when that index showed a positive return, but would have exceeded the S&P in years when the index showed a negative return. Over the years, the tax costs would have caused the aggregate lag to be substantial. 2. BERKSHIRE HATHAWAY INC. To the Shareholders of Berkshire Hathaway Inc.: Our gain in net worth during 2004 was $ billion, which increased the per-share book value of both our Class A and Class B stock by Over the last 40 years (that is, since present management took over) book value has grown from $19 to $55,824, a rate of compounded annually.
3 *. It's per-share intrinsic value that counts, however, not book value. Here, the news is good: Between 1964 and 2004, Berkshire morphed from a struggling northern textile business whose intrinsic value was less than book into a diversified enterprise worth far more than book. Our 40-year gain in intrinsic value has therefore somewhat exceeded our gain in book. (For an explanation of intrinsic value and the economic principles that guide Charlie Munger, my partner and Berkshire's vice-chairman, and me in running Berkshire, please read our Owner's Manual, beginning on page 73.). Despite their shortcomings, yearly calculations of book value are useful at Berkshire as a slightly understated gauge for measuring the long-term rate of increase in our intrinsic value. The calculations are less relevant, however, than they once were in rating any single year's performance versus the S&P 500. index (a comparison we display on the facing page). Our equity holdings (including convertible preferreds).
4 Have fallen considerably as a percentage of our net worth, from an average of 114% in the 1980s, for example, to less than 50% in recent years. Therefore, yearly movements in the stock market now affect a much smaller portion of our net worth than was once the case, a fact that will normally cause us to underperform in years when stocks rise substantially and overperform in years when they fall. However the yearly comparisons work out, Berkshire's long-term performance versus the S&P. remains all-important. Our shareholders can buy the S&P through an index fund at very low cost. Unless we achieve gains in per-share intrinsic value in the future that outdo the S&P, Charlie and I will be adding nothing to what you can accomplish on your own. Last year, Berkshire's book-value gain of fell short of the index's return. Our lackluster performance was not due to any stumbles by the CEOs of our operating businesses: As always, they pulled more than their share of the load.
5 My message to them is simple: Run your business as if it were the only asset your family will own over the next hundred years. Almost invariably they do just that and, after taking care of the needs of their business, send excess cash to Omaha for me to deploy. I didn't do that job very well last year. My hope was to make several multi-billion dollar acquisitions that would add new and significant streams of earnings to the many we already have. But I. struck out. Additionally, I found very few attractive securities to buy. Berkshire therefore ended the year with $43 billion of cash equivalents, not a happy position. Charlie and I will work to translate some of this hoard into more interesting assets during 2005, though we can't promise success. In one respect, 2004 was a remarkable year for the stock market, a fact buried in the maze of numbers on page 2. If you examine the 35 years since the 1960s ended, you will find that an investor's return, including dividends, from owning the S&P has averaged annually (well above what we expect future returns to be).
6 But if you look for years with returns anywhere close to that say, between 8% and 14% you will find only one before 2004. In other words, last year's normal return is anything but. *All figures used in this report apply to Berkshire's A shares, the successor to the only stock that the company had outstanding before 1996. The B shares have an economic interest equal to 1/30th that of the A. 3. Over the 35 years, American business has delivered terrific results. It should therefore have been easy for investors to earn juicy returns: All they had to do was piggyback Corporate America in a diversified, low-expense way. An index fund that they never touched would have done the job. Instead many investors have had experiences ranging from mediocre to disastrous. There have been three primary causes: first, high costs, usually because investors traded excessively or spent far too much on investment management; second, portfolio decisions based on tips and fads rather than on thoughtful, quantified evaluation of businesses; and third, a start-and-stop approach to the market marked by untimely entries (after an advance has been long underway) and exits (after periods of stagnation or decline).
7 Investors should remember that excitement and expenses are their enemies. And if they insist on trying to time their participation in equities, they should try to be fearful when others are greedy and greedy only when others are fearful. Sector Results As managers, Charlie and I want to give our owners the financial information and commentary we would wish to receive if our roles were reversed. To do this with both clarity and reasonable brevity becomes more difficult as Berkshire's scope widens. Some of our businesses have vastly different economic characteristics from others, which means that our consolidated statements, with their jumble of figures, make useful analysis almost impossible. On the following pages, therefore, we will present some balance sheet and earnings figures from our four major categories of businesses along with commentary about each. We particularly want you to understand the limited circumstances under which we will use debt, given that we typically shun it.
8 We will not, however, inundate you with data that has no real value in estimating Berkshire's intrinsic value. Doing so would tend to obfuscate the facts that count. Regulated Utility Businesses We have an (fully diluted) interest in MidAmerican Energy Holdings, which owns a wide variety of utility operations. The largest of these are (1) Yorkshire Electricity and Northern Electric, whose million electric customers make it the third largest distributor of electricity in the ; (2). MidAmerican Energy, which serves 698,000 electric customers, primarily in Iowa; and (3) Kern River and Northern Natural pipelines, which carry of the natural gas consumed in the The remaining of MidAmerican is owned by three partners of ours: Dave Sokol and Greg Abel, the brilliant managers of these businesses, and Walter Scott, a long-time friend of mine who introduced me to the company. Because MidAmerican is subject to the Public Utility Holding Company Act ( PUHCA ), Berkshire's voting interest is limited to Voting control rests with Walter.
9 Our limited voting interest forces us to account for MidAmerican in an abbreviated manner. Instead of our fully incorporating the company's assets, liabilities, revenues and expenses into Berkshire's statements, we make one-line entries only in both our balance sheet and income account. It's likely, though, that PUHCA will someday perhaps soon be repealed or that accounting rules will change. Berkshire's consolidated figures would then incorporate all of MidAmerican, including the substantial debt it utilizes (though this debt is not now, nor will it ever be, an obligation of Berkshire). At yearend, $ billion of MidAmerican's junior debt was payable to Berkshire. This debt has allowed acquisitions to be financed without our partners needing to increase their already substantial investments in MidAmerican. By charging 11% interest, Berkshire is compensated fairly for putting up the funds needed for purchases, while our partners are spared dilution of their equity interests.
10 Because MidAmerican made no large acquisitions last year, it paid down $100 million of what it owes us. 4. MidAmerican also owns a significant non-utility business, HomeServices of America, the second largest real estate broker in the country. Unlike our utility operations, this business is highly cyclical, but nevertheless one we view enthusiastically. We have an exceptional manager, Ron Peltier, who through both his acquisition and operational skills is building a brokerage powerhouse. HomeServices participated in $ billion of transactions in 2004, a gain of $ billion from 2003. About 24% of the increase came from six acquisitions made during the year. Through our 17. brokerage firms all of which retain their local identities we employ more than 18,000 brokers in 18. states. HomeServices is almost certain to grow substantially in the next decade as we continue to acquire leading localized operations. Last year MidAmerican wrote off a major investment in a zinc recovery project that was initiated in 1998 and became operational in 2002.