Transcription of November 2017 How’s Life in Brazil? - OECD.org - …
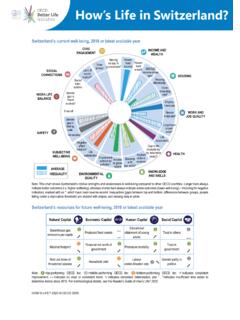
1 1 November 2017 How s life in brazil ? The figure below shows brazil s relative strengths and weaknesses in well-being, with reference both to the OECD average and to the average outcomes of the OECD partner countries considered in How s life ? 2017 ( brazil , Colombia, Costa Rica, Lithuania, the Russian Federation and South Africa). brazil shows several areas of strength relative to both the OECD and partner country averages: only 7% of employees regularly worked 50 hours or more in 2016, below both the OECD average (13%) and the average in partner countries (9%). Social support is also high: in the period 2014-16, 90% of Brazilians reported having friends or relatives whom they can count on in times of trouble, very close to the OECD average. Voter turnout in brazil was almost 79% in 2014, higher than the average both for the OECD (almost 69%) and the partner countries (70%). Finally, air quality (measured in terms of average annual exposure to air pollution) is better than both the OECD and partner country averages.
2 There are also several outcomes where brazil is above the average for partner countries, but below the OECD average. Its employment rate, at in 2016, is higher than the average of partner countries ( ) but below the OECD average (67%). A relatively high percentage of Brazilians live in housing without basic sanitation ( ), a share that is higher than the OECD average of but lower than the average of partner countries ( ). life expectancy at birth is almost 75 years, which is above the average of the partner countries (72) but below the OECD average (80). While almost 72% of Brazilians say that they are satisfied with their local water quality, the share is only 66% for the partner countries as a whole. brazil also has some areas of weakness compared to both the OECD and other partner countries. Rates for both adults upper secondary educational attainment (49%) and students cognitive skills at age 15 are among the lowest in both the OECD and partner countries.
3 Personal security is also low: the homicide rate is among the highest across the OECD and partner countries, while only 37% of Brazilian people report feeling safe when walking alone at night in the area where they live. This is among the lowest in both the OECD and partner countries. Current well-being strengths and weaknesses in brazil Note: Both the OECD and partner country averages are typically population-weighted (see the online data annex for further details). Only headline well-being indicators with a complete or almost complete coverage of the OECD partner countries are considered ( one or no missing countries per indicator). Additional information, including the data used in this country note, can be found at: StrengthsStrengths relative to the OECD averageStrengths relative to partner countries WeaknessesAbove average for both the OECD and partner countriesAbove the OECD average, but below partner countries' averageAbove partner countries' average, but below the OECD averageBelow average for both the OECD and partner countries Working hours Employment Educational attainment Voter turnout Basic sanitation Cognitive skills at 15 Air quality life expectancy Homicides Water quality Feeling safe at night2 Change in brazil 's average well-being over the past 10 years Dimension Description Change Income and wealth [No time series data available].
4 Jobs and earnings The employment rate decreased sharply in 2015, falling 4% below the level recorded in 2005. Housing conditions [No time series data available] .. Work- life balance The past decade has witnessed a large fall in the percentage of employees working very long hours, from 16% in 2005 to 7% in 2015. This brings brazil below the OECD average of 13%. Health status life expectancy at birth has increased by nearly 3 years since 2005, but stands below the OECD average by almost 6 years. Education and skills The share of adults with at least an upper secondary level of education has increased considerably over the past decade, from 37% in 2007 to 49% in 2015. However, this remains 18 percentage points below the OECD average. Social connections The share of people reporting that they have relatives or friends whom they can count on to help in case of need has remained relatively stable since 2005, in contrast with the slight decrease recorded for the OECD average.
5 Civic engagement As in over half of all OECD countries, voter turnout has fallen over the last decade. The percentage of votes cast among the population registered to vote in the presidential elections was 4 points lower in 2014 than in 2006. Environmental quality The share of people satisfied with their local water quality has fallen from 78% to 72% over the last 10 years. On the other hand, air pollution levels in 2013 were close to those in 2005. Personal security The homicide rate has risen in the last 10 years, from 25 to 28 deaths per 100 000 people, in contrast to the falls observed in most OECD countries. The percentage of the population declaring that they feel safe when walking alone at night has remained broadly stable. Subjective well-being life satisfaction has remained relatively stable over the decade. Note: For each indicator in every dimension: refers to an improvement; indicates little or no change; and signals deterioration.
6 This is based on a comparison of the starting year (2005 in most cases) and the latest available year (usually 2015 or 2016). The order of the arrows shown in column three corresponds to that of the indicators mentioned in column two. 3 brazil s resources and risks for future well-being: Illustrative indicators Natural capital Human capital Indicator Equivalent OECD tier Change Indicator Equivalent OECD tier Change Greenhouse gas emissions from domestic production 2005-2012 Young adult educational attainment 2007-2015 CO2 emissions from domestic consumption 2001-2011 Educational expectancy .. 2015 Exposure to air pollution 2005-2013 Cognitive skills at age 15 .. 2015 Forest area 2005-2014 life expectancy at birth 2005-2015 Renewable freshwater resources .. Long-term annual avg Smoking prevalence 2006-2014 Freshwater abstractions .. 2012 Obesity prevalence .. 2013 No data available on threatened species.
7 No data available on adult skills and long-term unemployment. Economic capital Social capital Indicator Equivalent OECD tier Change Indicator Equivalent OECD tier Change Gross fixed capital formation 2005-2011 Trust in the national government 2005-2016 Financial net worth of total economy 2005-2009 Voter turnout 2006-2014 Household debt 2010-2014 Government stakeholder engagement .. 2014 Financial net worth of government 2009-2014 No data available on trust in others, trust in the police and volunteering in organisations. No data available on produced fixed assets, intellectual property assets, investment in R&D, household net wealth and banking sector leverage Improving over time Equivalent to the top-performing OECD tier, latest available year Worsening over time Equivalent to the middle-performing OECD tier, latest available year No change Equivalent to the bottom-performing OECD tier, latest available year.
8 No data available 4 HOW LARGE ARE WELL-BEING INEQUALITIES IN brazil ? Compared to OECD countries, brazil has large vertical inequalities in household income and the cognitive skills of 15-year-old students. brazil has mixed outcomes in relation to gender inequality. For example, gaps between men and women are higher than the OECD average in terms of employment and unemployment with women in brazil 50% more likely to be unemployed than men. By contrast, girls and boys perform equally well in tests of cognitive skills at age 15, and women are much more likely than men to have attained an upper secondary or tertiary education. Compared to middle-aged adults, Brazilian young people are more disadvantaged than in the average OECD country in a number of well-being indicators, including household income and unemployment the latter being three times higher for younger members of the population.
9 Conversely, the young are far more likely than middle-aged adults to attain upper secondary or tertiary levels of education, while benefitting from stronger support networks. These advantages are more marked in brazil than in most OECD countries. People with a tertiary education tend to fare better than those with only a secondary education across a range of well-being outcomes. In brazil , these education-related divides are similar to the OECD average in terms of employment, unemployment and cognitive skills at age 15. Moreover, voter turnout and social support are very similar in brazil for these two groups. However, people having attained tertiary education are much more likely to feel safe when walking alone at night. brazil experiences comparatively high levels of deprivation across various areas of well-being, including income poverty, education and personal security. Voter turnout stands out as an exception, although voting in brazil is compulsory.
10 What is inequality and how is it measured? Measuring inequality means trying to describe how unevenly distributed outcomes are in society. How s life ? 2017 adopts several different approaches: - Measures of vertical inequalities address how unequally outcomes are spread across all people in society for example, by looking at the size of the gap between people at the bottom of the distribution and people at the top. - Measures of horizontal inequalities focus on the gap between population groups defined by specific characteristics (such as men and women, young and old, people with higher and lower levels of education). - Measures of deprivation report the share of people who live below a certain level of well-being (such as those who face income poverty or live in an overcrowded household). top third of OECD countriesmiddle third of OECD countriesGenderAgeEducationbottom third of OECD countriesdata gapsno measuresHousehold incomeHousehold net wealthEarningsLow payEmploymentUnemploymentHousing affordabilityRooms per personLife expectancyPerceived healthWorking hoursTime offEducational attainmentCognitive skills at 15 Adult skillsTime spent socialisingSocial supportVoter turnoutHaving a say in governmentAir qualityWater qualityHomicidesFeeling safe at nightLife satisfactionNegative affect balanceWell-being inequalities in BrazilVertical inequalityHorizontal inequality byDeprivationWomen relative to menYoung relative to middle-agedSecondary relative to tertiary5 BETTER life INDEX The Better life Index is an interactive web application that invites citizens to compare well-being across OECD countries and beyond on the basis of the set of well-being indicators explored in How s life ?