Transcription of NSW Road Toll Statistics
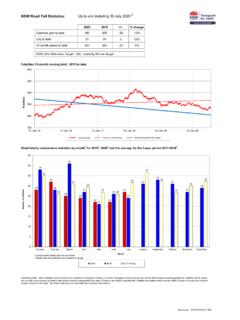
1 NSW road toll Statistics :Up to and including 30 July 2020 220202019+/- % change180205-25-12%2724313%331353-22-6%R oad fatality comparative Statistics by month1 for 20192, 20202 and the average for the 3-year period 2017-20192 Calendar year to dateJuly to date12-month period to datePreliminary Data - Note: Fatalities will be removed from Statistics if subsequent Police or Coronial investigation shows that they did not fall within National reporting guidelines. Fatalities will be added from a crash occurring prior to today's date where a person subsequently dies within 30 days or the crash is reported late. Fatalities are deaths which occurred within 30 days of a crash as a result of injuries received in the crash.
2 The crash must have occurred within the surveyed road 12-month moving total - 2015 to dateNSW 30% Reduction Target: 305, currently 26 over target2832252422222738284127212624313331 2729352631302726323732273032051015202530 354045 JanuaryFebruaryMarchAprilMayJuneJulyAugu st September October November DecemberNumber of fatalitiesMonth202020192017-19 avg25030035040045050001-Jan-1501-Jan-160 1-Jan-1701-Jan-1801-Jan-1901-Jan-20 FatalitiesTargetLinear (12-month total)1 Current month fatality data are incomplete2 Fatality data are preliminary and subject to change12-month total25030035040045050001-Jan-1501-Jan-1 601-Jan-1701-Jan-1801-Jan-1901-Jan-20 FatalitiesRoad Safety Plan 2021 target Trend (12-month total)12-month totalGenerated: 31/07/2020 9.
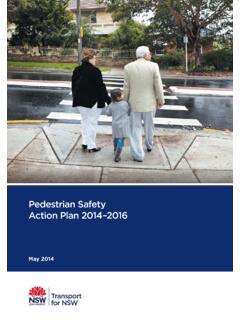
3 27 AM road fatality comparative Statistics for the period 01 January to 30 July 20192, 20202and the average for the same period in 2017, 2018 and 20192 road user classGenderAge groupUrbanisation2 Fatality data are preliminary and subject to change5215444161491310204060801001201401 60180 FemaleMaleNumber of fatalitiesGender202020192017-19 avg1366913273109710 20406080100120140160 CountryMetropolitanNumber of fatalitiesUrbanisation202020192017-19 avg23494941367255155363261140434034110 10203040506080+60-7940-5926-3917-250-16 Number of fatalitiesAge group202020192017-19 avg36639319329940309738102425830 20406080100120 PedestrianPedal cyclistPassengerMotorcyclistDriverNumber of fatalitiesRoad user class202020192017-19 avgExcludes unknown ageMotorcyclist & pedal cyclist includes passengerExcludes unknown genderGenerated: 31/07/2020 9.
4 28 AM road fatality comparative Statistics for the period 01 January to 30 July 20192, 20202and the average for the same period in 2017, 2018 and 20192 road user class20202019+/-% change3-yearaverageDriver8397-14-14% cyclist109111% & pedal cyclist includes passengerGender20202019+/-% change3-yearaverageMale131161-30-19% unknown genderAge group20202019+/-% change3-yearaverage0-16116583% +1125-14-56% unknown ageUrbanisation20202019+/-% change3-yearaverageMetropolitan7173-2-3% Fatality data are preliminary and subject to changeGenerated: 31/07/2020 9:28 AM Generated:31/07/2020 07:55 Thursday, 30 July 2020up to and includingRoad toll Update for NSWPage 1 of 1 Preliminary Data -Note: Fatalities will be removed from Statistics if subsequent Police or Coronial investigation shows that they did not fall withinNational reporting guidelines.
5 Fatalities will be added from a crash occurring prior to today's date where a person subsequently dies within 30 days or the crash is reported late. Typically, these variations may result in a statewide annual decrease of up to 12 fatalities from the initial preliminary advised since last update issued: Fatalities excluded since last update issued:10* Includes passengersFatal crashes Fatalities 356332 PRELIMINARY 2019 TOTALS: TOTAL KILLEDF atalitiesFatal crashesDriverPassengerMotorcyclist*Pedes trianPedal cyclist*Other 83 24 25 38 10 0 97 40 30 29 9 0-14-16-5910 93 39 31 36 6 0-10-15-6240 180 205-25 206-26 165 189-24 188-23(Prelim) YEAR TO MIDNIGHT 30 July 154 44 63 55 15 0 168 64 57 52 12 0-14-206 3 3 0 171 67 57 59 10 0-17-236-450 331 353-22 364-33 308 330-22 337-29(Prelim) PERIOD ENDING 30 Julyfor more information about traffic crash statisticsClick herefor more information about the Centre for road SafetyClick here(Prelim)(Prelim)