Transcription of Nursing for Elderly in Japan - Japanese Nursing Association
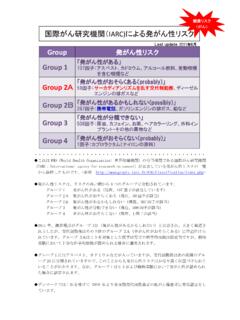
1 Nursing for the older people in Japan 1. The Aging of the Japanese Population Japanese Nursing Association 1. The Aging of the Japanese Population 2. Nursing for the Older People: Current Situation and Challenges (to be issued soon). 3. The Japanese Nursing Association in Action(to be issued soon). 2. Glossary Population aging rate: Ratio of people aged 65 and over to the total population Birth rate = Number of births / Population 1,000. Total fertility rate: Sum of the age-specific birth rates of women aged between 15 and 49. 3. An Aging World: Percentage of People Aged 65 and over in Selected Countries 45. 40. 35. Australia Canada 30 Japan United Kingdom United States of 25 America Indonesia Philippines 20 Viet Nam India Malaysia 15. Thailand China 10. 5. 0. Source: Population Division of the Department of Economic and Social Affairs of the United Nations Secretariat, World Population Prospects The 2010 Revision, National Institute of Population and Social Security Research, Population Projections for Japan (January 2012) for data for Japan after 2010.
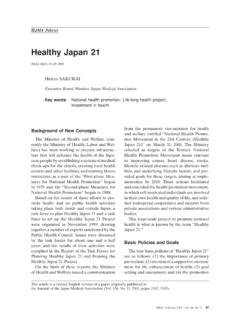
2 Population aging is a worldwide phenomenon. Japan is aging faster than any other countries. 4. Population aging rate in Japan : (As of October 1, 2012). Life expectancy at birth male Healthy life expectancy Gap of 9years Life expectancy at birth female Healthy life expectancy Gap of 12 years 0 20 40 60 80 100. (Years of age). resources : Population aging rate: cabinet office , Annual Report on Aging society 2013. Life expectancy at birth: Ministry of Health, Labour and Welfare, Abridged life table for Japan 2011. Healthy life expectancy: Grant-in Aid for comprehensive research on cardiovascular and lifestyle related diseases form the Ministry of Health, Labour and Welfare. Study of the future prospects on healthy life expectancy and cost- effectiveness of the measure for the life-style related diseases. Representative of the study group ; Syuji Hashimoto.
3 The Japanese population has been aging rapidly. The population aging rate reached in 2012. The life expectancy at birth for the Japanese is the one of the longest in the world. The gap between the life expectancy at birth and the healthy life expectancy, which represents the average period of no health-related constraints in daily life, is about 9 years for men and about 12 years for women. 5. Why is the Japanese society aging rapidly? A rise in the population aged 65 and over due to an increasing life expectancy at birth A fall in the youth population due to a declining birth rate Resource: Cabinet office , Annual Report on Aging society 2013. After World War II, infant and youth mortality fell significantly due to a better living environment, improvements in diet and nutrition, and the advancement of medical technology. The mortality rate for the older people, who are 65 and over, has been on the decline since WWII.
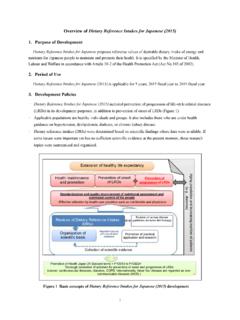
4 Overall mortality has recently been on the rise, because the percentage of the older people is increasing in an aging society. Decline in the number of children in Japan : The total fertility rate was in 2011. The declining birth rate is caused by a range of factors: an increasing percentage of unmarried people, the tendency to marry and have children later, more and more women willing to work, and growing job insecurity as highlighted by an increase in the number of non-regular workers. References: Cabinet Office. Annual Report on the Aging Society 2013. Cabinet Office. Declining Birthrate White Paper 2013. 6. Japan is entering a long period of population decline. (person) (%). 140,000 120,000 population estimates 100,000 age 0-19. 80,000 age 20 -64. 60,000 40,000 age 65-74. 20,000 age 75 and over 0 Resource: National Institution of Population and Social Security Research, Population Projection for Japan (January 2012).
5 The number of the older people will rise while the total population will fall. Japan entering a long period of population decline. According to projections by the National Institute of Population and Social Security Research, Japan 's total population is expected to drop from million in 2010 to million by 2060. A rise in the number of the older people amid a declining total population means that the Elderly ratio will continue to go up. 7. The first baby boomers will be 65 years old and over by 2015. The first baby boom between 1947 and 1949 in the aftermath of WWII resulted in the annual number of live births reaching around million. These first baby boomers will be 65 years old and over by 2015. On the other hand, the youth population, which constitutes the bottom of the population pyramid, will continue to fall due to a declining birth rate.
6 Reference: Cabinet Office. Declining Birthrate White Paper 2013. 8. The birth rate in Japan will continue to fall. Transition of birth rate (%). (per 1,000 of the population). (projection data after 2020). 9 8 7 6 5 Birth rate 4 Total fertility rate 3 2 1 0 2012 2020 2030 2040 2050 2060 (year). Resource: National Institution of Population and Social Security Research, Population Projection for Japan (January 2012). The 2012 data is from Vital Statistics published by the Ministry of Health Labour and Welfare Given a declining birth rate and a low total fertility rate, the youth population will continue to fall, resulting in the ratio of older people going up. 9. As the population ages, the age composition of population in Japan will change greatly. 70%. 60%. 50%. 40% age 0-19. age 20-64. 30%. age 65 and over 20% 10% 0%. Resource: Population estimates(as of 2012 2060 Oct.)
7 1st, 2012) by Ministry of Internal Affairs and Communications, Population Projection for Japan ( January 2012) by National Institution of Population and Social Security Research One older person is One older person will be supported by supported by working-age people. working-age persons. On average, one older person was supported by persons in the working age bracket(20-64 years of age) in 2012. By 2060, one in every of the Japanese population will be 65 years and over. One older person will be supported by persons in this bracket by that year. 10. As people get older, the more affected their daily lives are. Proportion of people aged 65 and over who say their daily life is affected by subjective symptoms (multiple answers allowed) (per 1,000 people). total activities of daily living age 60-64. go out age 65-69. age 70-74. age 75-79.
8 Work/housework/studies age 80-84. age 85 and over physical activities othres 0 100 200 300 400. Resource: National livelihood survey 2010. 11. People see their daily life more affected with aging. The traditional system of mutual help based on the family is weakening. Transition of the number of age 65 and over (1,000 people). based on the family form (estimated number). 35 000. 30 000. 25 000. 20 000. 15 000. 10 000. 5 000. 1986 1989 1992 1995 1998 2001 2004 2007 2010 2011 2012. living with non-relatives living with relatives living with unmarried children live with son/dauter and his/her partner a married couple only one-person households Notes: 1. The figures for 1995 exclude those of Hyogo Prefecture. Source: National livelihood survey 2012 by Ministry of Health 2. The figures for 2011 exclude those of Iwate, Miyagi, and Fukushima Labour and Welfare prefectures.
9 3. The figures for 2012 exclude those of Fukushima Prefecture. Traditionally, Japanese people often lived with their elder parents and even their grandparents and took care of them. More recently, however, the percentage of three- generation households has been decreasing, and the size of the average household has been shrinking due to increases in the percentages of nuclear families and one-person households. The percentage of older people who lived with their child(ren) dropped from nearly 70% in 1980 to in 2012. By contrast, the percentage of people aged 65 and over who live alone or with their spouse only has been on the rise. A 2012. survey shows that aged households accounted for of all households. People aged 75 and over more likely live alone or with their child's family than those aged 65-74. 12. Social Security System in Japan Japan 's social security system are roughly divided into four component pillars: social insurance, social welfare, public assistance, and public health.
10 The core social insurance scheme are health insurance, pension insurance, labor insurance, and long-term care insurance. 13. Health Insurance System The health insurance system of Japan guarantees universal coverage in accordance with the National Health Insurance Act. Under this system, everyone has access to appropriate health care at any time and anywhere in Japan . Patient(insured person) Medical institution See a doctor/. Pay part of fee Government Health care service Premiums Payment of medical expenditure Charging medical fee Share of Public funds Payment of medical expenditure - National Health Insurance - Health Insurance Managed by Association charge - Mutual Aid Association - Seamen's Insurance Screening and payment institutions -Health Insurance Managed by Japan Health Insurance Association Source/Reference: Summary of Health System in Japan by Ministry of Health Labour and Welfare, accessed at Healthcare system for the later-stage in September 18 ,2013.