Transcription of OCR AS Level Physics A (H156/02): Depth in physics …
1 AS Level Physics A. h156 /02 Depth in Physics Sample Question Paper Date Morning/Afternoon Time allowed: 1 hour 30 minutes You must have: the Data, Formulae and Relationships Booklet EN. You may use: a scientific or graphical calculator * 0 0 0 0 0 0 *. IM. First name EC. Last name Centre Candidate number number SP. INSTRUCTIONS. Use black ink. You may use an HB pencil for graphs and diagrams. Complete the boxes above with your name, centre number and candidate number. Answer all the questions. Write your answer to each question in the space provided.
2 Additional paper may be used if required but you must clearly show your candidate number, centre number and question number(s). Do not write in the bar codes. INFORMATION. The total mark for this paper is 70. The marks for each question are shown in brackets [ ]. Quality of extended responses will be assessed in questions marked with an asterisk (*). This document consists of 20 pages. OCR 2016 h156 /02. [601/4742/8] DC ( ) Turn over 2. Answer all the questions. 1 Fig. shows a sign hanging from a rod fixed to a vertical wall.
3 A metal wire attached between the rod and the wall holds the rod horizontal. EN The weight W of the sign and rod act through the centre point of the rod. The value W is IM. 120 N. The angle between wire and rod is 30o. (a) Explain why the vertical force exerted on the rod by the wire is 60 N. EC.. SP.. [2]. (b) Calculate the tension T in the wire. T = N [2]. OCR 2016 h156 /02. 3. (c) (i) Draw an arrow on Fig. to show the direction of the force exerted on the rod by the wall. [1]. (ii) State how you chose this direction.. [1].
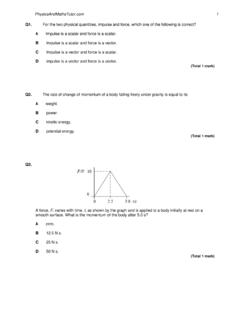
4 Question 2 begins on page 4. EN. IM. EC. SP. OCR 2016 h156 /02 Turn over 4. 2 Fig. shows the path of a golf ball which is struck at point F on the fairway landing at point G on the green. The effect of air resistance is negligible. Fig. The ball leaves the club at 17 m s 1 at an angle of 60o to the horizontal at time t = 0. (a) Show that the speed of the ball at the highest point H of the trajectory is between 8 and 9 m s 1. EN. IM. speed = .. m s 1 [2]. (b) At t = s the ball reaches point H. Calculate EC. (i) the maximum height h of the ball SP.
5 H = . m [3]. (ii) the distance between the points F and G. distance FG = . m [2]. OCR 2016 h156 /02. 5. (c) Suppose the same golfer standing at F had hit the ball with the same speed but at an angle of 30o to the horizontal. See Fig. Fig. Show that the ball would still land at G. EN. IM. [3]. (d) Compare the magnitude and direction of the two velocities as the ball lands at G and EC. using this information suggest, with a reason, which trajectory you would choose to travel a longer distance after hitting the green at G.. SP.
6 [2]. OCR 2016 h156 /02 Turn over 6. 3 A sports manufacturer is testing the quality of one of their footballs. (a) Fig. shows how the force F applied to a football varies with time t whilst it is being kicked horizontally. The ball is initially at rest. EN. Fig. (i) Use the graph to find: IM. 1 the maximum force applied to the ball ..N. EC. 2 the time the boot is in contact with the ball s. [1]. SP. (ii) The mean force multiplied by the time of contact is called the impulse delivered to the ball. The impulse delivered to the ball is about N s.
7 Explain how you would use the graph to show that the impulse has this value.. [2]. OCR 2016 h156 /02. 7. (b) The mass of the ball is kg. Use your answers in (a) to calculate (i) the maximum acceleration of the ball acceleration = . m s 2 [2]. (ii) the final speed of the ball. EN. IM. speed = .. m s 1 [2]. EC. (c) The ball hits a wall with a speed of 11 m s 1. It rebounds from the wall along its initial path with a speed of m s 1. The impact lasts for s. Calculate the mean force exerted by the ball on the wall. SP. mean force = N [3].
8 OCR 2016 h156 /02 Turn over 8. 4 (a) Name the charge carriers responsible for electric current in a metal . and in an electrolyte . [1]. (b) A copper rod of cross-sectional area x 10 4 m2 is used to transmit large currents. A charge of 650 C passes along the rod every s. Calculate (i) the current I in the rod (ii) EN I = .. A. the total number of electrons passing any point in the rod per second [1]. IM. EC. number per second = .. [1]. SP. (iii) the mean drift velocity of the electrons in the rod given that the number density of free electrons is x 1029 m 3.
9 Mean drift velocity = m s 1 [2]. OCR 2016 h156 /02. 9. (c) The copper rod in (b) labelled X in Fig. is connected to a longer thinner copper rod Y. Fig. State (i). why t State why the current in Y must also be I.. [1]. (ii) Rod Y has half the cross-sectional area of rod X. Calculate the mean drift velocity of electrons in Y. EN. IM. mean drift velocity = m s 1 [1]. EC. SP. OCR 2016 h156 /02 Turn over 10. 5 (a) The circuit in Fig. consists of a supply of 45 V and negligible internal resistance and three resistors. Fig. Two of the resistors have resistances 1000 and 750 as shown.
10 EN. The current drawn from the supply is A. Calculate the resistance of R. IM. EC. SP. resistance = .. [4]. OCR 2016 h156 /02. 11. (b)* Students are given a light dependent resistor (LDR) and asked to design a circuit for a light meter to monitor changes in light intensity. The meter reading must rise when the light intensity increases. The incident light may cause the resistance of the LDR to vary between 1500 and 250 . The students are asked to use the supply and one of the resistors from (a) above and either a voltmeter or ammeter.