Transcription of Ohio Deferred Compensation Investment Performance …
1 Ohio Deferred CompensationInvestment Performance Report As of March 31, 2022 The results shown represent past Performance and should not be considered a representation of future Performance or experience. Past Performance cannot guarantee future results. Current Investment results may be lower or higher than quoted in this report. The principal value and Investment return of an Investment will fluctuate so that an investor's units/shares, when redeemed, may be worth more or less than their original cost. Performance data current to the most recent month-end may be obtained by visiting Although data is gathered from Investment providers, the Program cannot guarantee completeness and accuracy.
2 Please see other important disclosures at the end of this report. Consider the Investment objectives, risks, charges, and expenses carefully before investing by consulting your prospectuses, which contain this and other information. Prospectuses are available by calling 877-644-6457 or visiting Read the prospectus carefully before 1st Average Annual Returns ExpenseFund Name (Manager or Ticker Symbol) Date Quarter 1 Year 3 Year 5 Year 10 Year Ratio(1) Ohio DC LifePath Portfolios (BlackRock)(2)LifePath Retirement(3) 8/15/2017 2025(3) 8/15/2017 2030(3) 8/15/2017 2035(3) 8/15 2040(3)
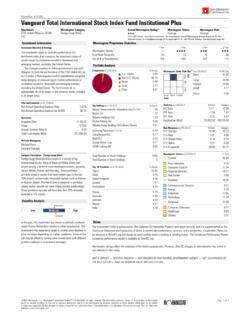
3 8/15/2017 2045(3) 8/15/2017 2050(3) 8/15/2017 2055(3) 8/15/2017 2060(3) 8/15/2017 (4) International Stock FundsOhio DC International Stock 9/11/2020 (4) n/a n/a (Vanguard, Schroders, Arrowstreet)(2)Vanguard Total International Stock Index (VTPSX)(5) 11/30/2010 Small-Cap Mid-Cap Stock FundsOhio DC Small-Cap Growth (Westfield, Fiera)(2) 6/2/2017 (4) n/a DC Small-Cap value (Westwood)(2) 6/2/2017 (4) n/a Extended Market Index (VEMPX)(5) (6) 1/14/2011 Capital Opportunity (VHCAX)(5) (6) 11/12/2001 Large-Cap Stock FundsDodge & Cox Stock (DODGX)(5)
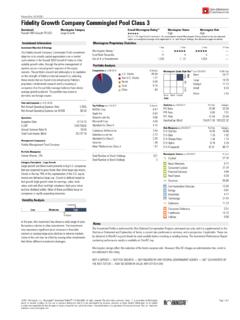
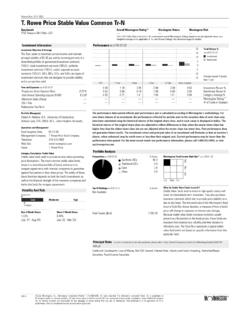
4 1/4/1965 Contrafund Commingled Pool(2) 1/17/2014 (4) Growth Company Commingled Pool(2) 12/13/2013 (4) DC Large-Cap Growth (T. Rowe Price)(2) 8/1/2014 (4) Institutional Index (VIIIX)(5) 7/7/1997 Bond Funds Ohio DC Intermediate Bond (TCW)(2) 1/30/2015 (4) Total Bond Market Index (VBMPX)(5) 2/5/2010 stable ValueOhio DC stable value Option (Multiple Managers)(2) 1/1/1994 Crediting Rates: 1st Quarter 2022 2nd Quarter 2022 (1) Investment Performance has been reduced for expense ratios.
5 These expense ratios may vary from period to period. Expense ratios do not include administrative fees or rebates of fee reimbursements. See "Administrative Fees and Rebates" for more information.(2)T hese options are not publicly traded mutual funds and do not have a ticker symbol or prospectus. Additional information regarding the manager(s) and Investment strategy can be found in the fund profile at The value of the securities held by the SVO will fluctuate. The SVO focuses on principal preservation and a stable rate of return.(3)Returns shown are of the respective LifePath Index N series. Returns for periods prior to the inception of the N series are those of the respective LifePath Index F series.
6 (4) Average annual return since inception date. (5) These options are publicly traded mutual funds, and they have a ticker symbol and prospectus. (6)T he asset class for Vanguard Extended Market Index is small/mid-cap stocks. The asset class for Vanguard Capital Opportunity is mid-cap Executives are registered representatives of Nationwide Investment Services Corporation, member Portfolios Each LifePath Portfolio is based on a target year (when you expect to begin using your money). Portfolios are designed to provide diversification and asset allocation across several types of investments and asset classes, primarily by investing in underlying funds.
7 LifePath Portfolios are designed for people who plan to begin withdrawing funds during or near a specific year. Like other funds, LifePath Portfolios are subject to market risk and loss. Loss of principal can occur at any time, including before, at, or after the target year. There is no guarantee that LifePath Portfolios will provide enough income for Stock Funds International funds involve risks not associated with investing solely in the United States, such as currency fluctuation, differences in accounting standards, and the limited availability of information. Over the long term, an investor should be willing to accept a high level of risk resulting from potentially higher market Stock Funds Small-cap funds contain stocks from companies with less than $2 billion in capitalization, including many start-up companies.
8 Small companies can grow much faster than big companies, but small company stocks tend to be more volatile than the stocks of larger companies. Over the long term, an investor should be willing to accept a high level of risk resulting from potentially higher market volatility. Mid-Cap Stock Funds Mid-cap funds contain stocks from companies with market values between $2 billion and $10 billion, and often include companies that are well established and growing. Over the long term, an investor should be willing to accept a moderate to high level of risk resulting from potentially higher market Stock Funds Large-cap funds contain stocks from companies with market values of more than $10 billion, and they include blue-chip and Fortune 500 companies.
9 They are typically more mature, diversified companies with many products and services. Over the long term, an investor should be willing to accept a moderate to high level of risk resulting from potentially higher market Funds Bonds are loans or debt instruments issued by governments or corporations that need to raise money. Bond funds have the same interest rate, inflation, and credit risks associated with the underlying bonds owned by the fund. Bonds are generally a more conservative form of Investment than stocks, and usually provide a more steady flow of income. Typically, bonds have a lower long-term total return than stocks.
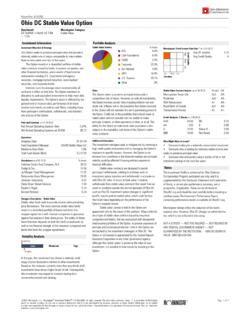
10 stable value These options own short to intermediate term, high-quality securities. Investors who seek safety of principal as well as a competitive rate of return compared to money market funds may invest in these options. The Ohio DC stable value Option returns are shown net of fees for Investment management, custody, and principal protection. A fund profile can be obtained for the Ohio DC stable value Option by calling 877-644-6457 or at Investment Performance Report NotesInvestment PerformanceAll reported returns assume reinvestment of capital gains and dividends and reflect the fund's expense ratio, but not the deduction of the administrative fee or reinvestment of rebates.