Transcription of OPERATIONAL LEARNINGS FROM MEMBRANE …
1 OPERATIONAL LEARNINGS FROM MEMBRANE biofouling OF A groundwater replenishment SCHEME Stacey Hamilton1, Clara Loi1, Rod Holme1, Rino Trolio1 1 Water Corporation of WA, 629 Newcastle St, Leederville 6007 ABSTRACT One of the major OPERATIONAL challenges of operating membranes in wastewater effluent recycling applications is the control of biological fouling. biofouling in the RO system has been a significant and ongoing issue in the operation of the groundwater replenishment Scheme (GWR GL) in Perth, WA. This paper outlines the studies that were conducted to control biofouling in order to increase the OPERATIONAL life of the RO membranes. INTRODUCTION As part of its wide ranging response to a drying climate, the Water Corporation conducted the groundwater replenishment Trial (GWRT) from 2010-2012, in Perth, Western Australia to build knowledge of the local technical, health, environmental and social issues associated with groundwater replenishment as a future drinking water source.
2 The Trial was successfully completed in December 2012 and all Trial Regulators the Department of Environment Regulation (DER), Department of Health (DoH) and Department of Water (DoW) indicated that the Trial met all the project objectives1. Since December 2012, the GWRT Advanced Water Recycling Plant (AWRP) has continued to operate as the GWR GL/year scheme (GWR GL). It was announced in August 2013 by the WA Water Minister that groundwater replenishment will be the next new climate independent water source for the Integrated Perth Water Supply Scheme2. The full-scale groundwater replenishment plant will be built in the same site in 2014-2015, and be OPERATIONAL in late 2016. The GWRT/GWR GL scheme recharged treated recycled water to the Leederville Aquifer.
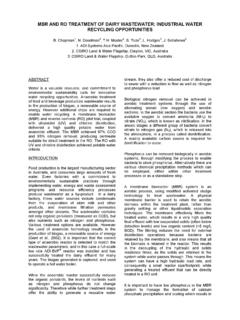
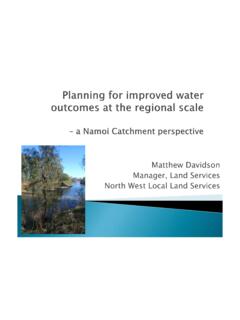
3 The Beenyup Wastewater Treatment Plant (WWTP) provides the AWRP with a portion of its secondary treated effluent. This effluent was further treated to drinking water standards before being recharged to the Leederville aquifer. The AWRP treatment process utilised ultrafiltration (UF) and reverse osmosis (RO) followed by ultraviolet (UV) disinfection (Figure 1). One of the major OPERATIONAL challenges of MEMBRANE filtration in wastewater effluent recycling applications is the control of biological fouling. Fouled membranes require chemical cleaning and ultimately result in water production loss, integrity loss, poorer water quality and a shorter MEMBRANE life which imposes a large economic weight on MEMBRANE plant operation3. Prevention and/or control of biofouling is essential for maintaining MEMBRANE operation to meet production volumes.
4 In order to maintain long term OPERATIONAL stability, an intermittent cleaning process is required. The various cleaning processes used for fouling control fall into three catergories: prevention, maintenance and recovery4. OPERATIONAL costs also increase with the requirement for frequent chemical cleaning of membranes, so management of biofouling is crucial. The level of biofouling that occurs on membranes is dependent on a variety of factors including the raw water quality entering the system (including the nutrient loading), and OPERATIONAL parameters at the AWRP. The Water Corporation currently operates two AWRPs with comparable treatment systems (the groundwater replenishment scheme and one scheme for industrial purposes). The industrial application AWRP has not experienced any signficant biofouling issues compared to the groundwater replenishment AWRP.
5 RO membranes at the industrial AWRP have only begun to be replaced after 10 years of service, well above the recommended lifespan expected from the MEMBRANE manufacturer. As biofouling in the RO system has been a major ongoing issue in the operation of the groundwater replenishment AWRP, it has become the subject of a number of studies. This paper will describe the studies conducted to investigate the cause of the biofouling and how to control it by the use of biofouling management strategy in order to increase the OPERATIONAL life of the RO membranes. Figure 1: The Advanced Water Treatment Process for GWRT / GWR GL. METHODOLOGY AWRP Membranes The AWRP consisted of three UF trains operating in parallel (13 x 6) with Seimens Memcor L20 N membranes. The RO system consisted of two parallel trains.
6 Both trains were two stage, single pass (15 x 8) with 7 elements in each vessel. The RO membranes were Hydranautics ESPA2-LD membranes. RO MEMBRANE Autopsy and Biofilm Investigations The RO MEMBRANE autopsy was carried out by Advanced Water Management Centre from the University of Queensland. Characterisation of the MEMBRANE was done by several analytical techniques including: Loss of ignition (LOI) Metals Polysaccharides/Proteins Biomass quantification Scanning electron microscopy (SEM) Filtration trials Debris was also collected by scaping a 1m2 surface area on the wall of the UF and RO feed tanks within the AWRP. The debris was characterised by several analytical techniques by the Chemistry Centre of Western Australia including: Extraction of polysaccharides Hydrolysis of polysaccharides Sugar analysis (including HPLC analysis) ATP Metals LOI 550 C Protein The full autopsy report and biofilm results can be presented on request.
7 Chemical in Place (CIP) Cleanings A variety of CIPs were attempted at the AWRP to control biofouling . A CIP was initiated once the differential pressure (dP) across each stage was > 20 % from the previous clean. The type of cleans attempted (with the recirculation time and soak times) is shown in Table 1. Chlorine: Ammonia Dosing Experiments Bench scale experiments were conducted to determine the optimum chlorine to ammonia dosing ratio, and to also avoid nitrosame formation above the health guideline value of 100 ng/L. AWRP feedwater was dosed with chlorine to ammonia ratios of 4:1 8:1 in a nitrosamine formation potential experiment under both plant conditions at the time of sampling (4 hours and 20 minutes) and a worst case scenario (6 hours). Samples were quenched with sodium thiosulphate and analysed for 9 nitrosamine compounds.
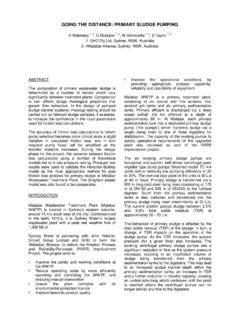
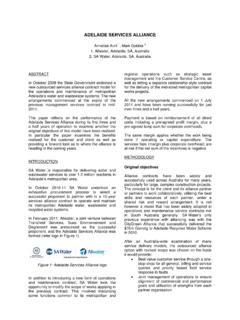
8 The 9 nitrosamines were: N-nitrosodi-n-butylamine (NDBA) N-nitrosodi-n-propylamine (NDPA) N-nitrosodiethylamine (NDEA) N-nitrosodimethylamine (NDMA) N-nitrosoethylmethylamine (NEMA) N-nitrosopiperidine (NPIP) N-nitroso-morpholine (NMOR) N-nitroso-pyrrolidine NPYR) N-nitroso-diphenylamine (NDHPA) The AWRP treatment process flow during the experiments is shown in Figure 2. Table 1: CIPs Attempted at the AWRP CIP Type Recirculation Time Soak Time Max dP recovered (kPa) Permeate 2 hours 1 hour 1 Acid (usually after a caustic CIP) 45 mins hours 15 1 hour hours 2 hours hours Biocide 2 hours N/A 8 2 hours 2 hours 2 hours 24 hours Biocide + citric acid 15 mins 15 mins 10 Caustic 1 hours 30 mins 2 hours 1 hour Hot Water 4 hours N/A 10 Hydrex (normal CIP) 2 hours 1 hour 16 Hydrex (reverse lead and tail) 2 hours 1 hour 21 Hydrex (reverse pipework) 2 hours 1 hour 33 Salt 90 mins N/A 12 Figure 2: Treatment Process of the AWRP at time of sampling for the chlorine: ammonia experiments.
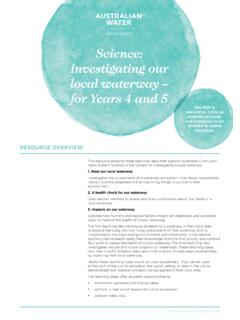
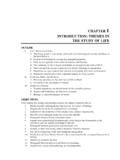
9 Figure 3: Differential Pressure Profile of RO Train 2 over OPERATIONAL lifetime. RESULTS/OUTCOMES The AWRP RO system encountered significant biofouling issues, which resulted in an increase in differential pressure and permeate conductivity due to MEMBRANE damage from frequent chemical cleaning. The original membranes in the AWRP were replaced after 18 months of operation due to severe biofouling and were replaced with Hydranautcis ESPA2 LD membranes. After installation of the membranes in November 2011, biofouling was identified within two months of operation as the normalised differential pressure increased for both trains. Operation of the membranes has been recorded daily since installation. Figure 3 shows the differential pressure of RO Train 2 with the first stage in blue and the second stage in red for the lifetime of Train 2 with ESPA2 LD membranes.
10 An RO MEMBRANE element was taken out of the MEMBRANE system on 12th March 2013 for an autopsy. The fouling layer deposited on the MEMBRANE surface is presented in Figure 4. Scrapings from the RO and UF feed tanks are presented in Figure 5. Figure 4: RO MEMBRANE Surface Visual Aspect and Fouling Layer Deposited on MEMBRANE Surface. Results from the MEMBRANE autopsy and tank scrapings confirmed that the fouling layer is a mixture of biological and organic matter. Visual resemblance of the samples collected from RO feed tank (Figure 5b) suggest that the source of the fouling in the MEMBRANE system (Figure 4) is possibly the microorganisms from the biofilm that was deposited in the feed tank. a) b) Figure 5: biofouling captured from the a) UF and b) RO tanks.