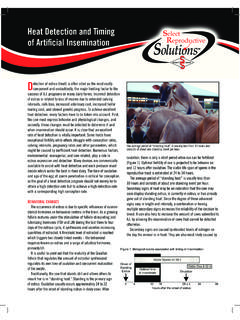
Transcription of Optimize Peak Detection & Integration with …
1 2011 Waters Corporation1 Noise and Drift CalculationsManaging Manually Integrated resultsSystem SuitabilityOptimize peak Detection & Integration with ApexTrack/Processing TheoryRune Buhl Frederiksen, Nordic Customer Education Manager 2011 Waters Corporation2 Presentation overview of Integration Theory Noise & Drift Calculations Managing Manually Integrated Results in a Result Set System Suitability Calculations and Limits Exercise 2011 Waters Corporation3 Integration requires three operations:1. Find the peak ( peak Detection )2. Find the baseline of the peak3. Compute the peak s area and height The first two are the challenge Empower has two different algorithms to perform Integration Traditional Apex TrackIntegration 2011 Waters Corporation4 Traditional Integration peak Width and Threshold work together to detect the peaks from the Global Parameters peak Width Threshold Minimum Area Minimum Height Traditional Integration4 Global Parameters 2011 Waters Corporation5 peak Width peak width is measured at the baseline of the narrowest peak of interest and is used to determine a bunching factor.
2 Bunching Factor= peak Width x Sampling Rate15B1B2B4B3B5B660=41 Traditional IntegrationPeak Width Determination 2011 Waters Corporation6 Traditional Integration Determining peak startThreshold Specifies the liftoff and touchdown values (minimum rate of change of the detector signal) for peak Detection . Empower averages the signal slope across 3 data bunch intervals and compares to the liftoff threshold When the average slope of the signal between the 3 bunches is the liftoff threshold value, point B1 is flagged as possible peak start Individual points in bunch B1 is then examined to determine peak start = data point with lowest Y-value22 slope 1 slopeslope average+=12 t-tB1 -B21 slope=23 t-tB2 -B32 slope= 2011 Waters Corporation7 Traditional Integration Determining peak apex Signal is monitored until slope sign changes from positive to negative Bunch where the slope change occurs (B12 in the figure) is analyzed.
3 Data point which is farthest away from the baseline is tentatively assigned as peak apex Final apex is determined after Integration and baseline assignment 2011 Waters Corporation8 Traditional Integration Determining peak end Slope of the signal is compared to the touchdown threshold When 2 consecutive slopes are < threshold, last point in the last bunch is flagged as possible peak end Individual points in this bunch and the next bunch to determine actual peak end = data point with lowest Y-value 2011 Waters Corporation9 Traditional Integration Minimum Height or Minimum AreaMinimum Height or Minimum Area Defines minimum peak area (mV*sec) or minimum peak height ( V) that Empower will report Used to reject unwanted peaks once Integration has been optimized Empower use 95% of the peak s area/ height so that it can report peaks that approach the selected peak s size 2011 Waters Corporation10 Traditional Integration Timed Events ParametersTimed Events a time-based actionto adjust peak Detection and/or Integration in specified sections of a chromatogram There are 20 Integration events that can be used to fine-tune Integration across selected regions of a chromatogram You might need to apply one or more timed events when the default peak Detection and Integration parameters do not adequately detect and integrate all peaks in the chromatogram.
4 2011 Waters Corporation11 Traditional Integration Timed Events II Inhibit Integration SPW Set peak Width SLO Set Liftoff STD Set Touchdown SMA Set Minimum Area SMH Set Minimum Height SMxA Set Maximum Area SMxH Set Maximum Height VV Valley to Valley ES Exponential Skim TS Tangential Skim ANP Allow Negative Peaks FDL Force Drop Line FBT Force Baseline by Time FBP Force Baseline by peak FHP Forward Horizontal by peak FHT Forward Horizontal by Time RHP Reverse Horizontal by peak RHT Reverse Horizontal by Time FP Force peak 2011 Waters Corporation12 ApexTrackIntegrationA New Approach to the Integration of Chromatographic Peaks Easier than traditional Integration Better than traditional Integration Based on measuring the curvature (the rate of change of slope) of the chromatogram (2ndderivative) Traditional Integration detects peaks by initially looking for a peak start ApexTrackintegration detects peaks by initially looking for the peak apex 2011 Waters Corporation13 ApexTrackIntegrationEasier: Automatically determines appropriate Integration parameter settings Auto peak Width Auto Threshold Usually integrates well at first pass using default and automatic parametersBetter: Integrates negative peaks effectively Integrates small peaks in noisy or drifting baseline effectively peak shoulders are easily detected Gaussian skimming available 2011 Waters Corporation14 System Policies 2011 Waters Corporation15 New Project Wizard 2011 Waters Corporation16 Basis of ApexTrack:Curvature Threshold Detects the peak apex when the curvatureis above the threshold Effective.
5 Detects shoulders Baseline slope does not affect Detection of peaks peak Detection and baseline determination are decoupledoBaseline placement can be modified without affecting the number of peaks detected and vise versa 2011 Waters Corporation17 Second Derivative Measures CurvatureCurvature1. ApexHigh (-)2. Inflection pointsZero3. Liftoff/TDHigh (+)4. derivative43214 2011 Waters Corporation18 Apex Track IntegrationApex Detection parameters Start (min) (Start Detection / Integration Time) End (min) (End Detection / Integration Time) peak Width (sec) ( peak Width @ 5% Height) AUTOoRecommended range= to 2 times Auto PW value Detection Threshold ( peak Detection Threshold) AUTOB aseline determination parameters Liftoff % Baseline start threshold %. Default:0 Touchdown % Baseline end threshold %. acceptance criteria Minimum Area (works in the same way as in traditional int.)
6 Minimum Height (works in the same way as in traditionalint.) 2011 Waters Corporation19 ApexTrack peak Detection peak Detection is controlled by the peak Width and Threshold parameters peak Width: measured in seconds, Auto peak width sets it to 5% height of the largest peak in the second derivative (determined by using the inflection point width and calculating the gaussianpeak width); used as a filter similar to traditional Integration . Threshold: measured in units of height, Auto Threshold sets it to the peak to peak noise; used as a threshold for peak Detection in the 2ndderivative 2011 Waters Corporation20 PeakWidthAutoWidth2nd derivative plot 2011 Waters Corporation21 ThresholdAutoWidthAutoThresholdPeak to peak noise2nd derivative plot 2011 Waters Corporation22 Apex detectionAutoWidthAutoThresholdApex DetectionApex DetectionConsidered as noise2nd derivative plot 2011 Waters Corporation23 AutoWidthAutoThresholdApex DetectionApex DetectionConsidered as noiseWhat happens?
7 The chromatogram s second peak width (AutoPeakWidth) threshold (AutoThreshold) peaks-Second inflection pointsApex Track Integration2nd derivative plot 2011 Waters Corporation24 Unprocessed ChromatogramSecond Derivative PlotIntegrated ChromatogramBaselineResolved PeakFused Peaks(Round)Fused Peaks(Shoulder)Fused Peaks(Valley) 2011 Waters Corporation25 Apex Track Integration Baseline DeterminationWhat about Baseline determination? ApexTrackuses percentageslope slope threshold depends on peak heightoThe baseline is the same for all peaksWhy? Baselines change when concentration changes and the location of touchdown is most happens? User specifies baseline threshold as a percentageof peak height. Algorithm computes a separate slope threshold for each peak Slope threshold is then proportionalto peak heightoBig peaks have big thresholdoSmall peaks have small threshold 2011 Waters Corporation26 Baseline draws baseline between the inflection slope differences ( m)using tangents to the inflection slope thresholds using Baseline % Thresholds from processing method and slope % Thresholds scale inflection point slope differences to determine liftoff and touchdown points.
8 M1 m2 Peakstart = m1 x Liftoff%/100 Peakstop = m2 x Tuchdown%/100 2011 Waters Corporation27 Baseline start at the inflection point are expanded until the slope threshold criteria are Baseline % Threshold of 100 % yields baseline at inflection Baseline % Threshold of 0 % yields baseline that is tangent to baseline noise 2011 Waters Corporation28 Concentration Change:Traditional Approach Height ratios of 1: 1/10 : 1/100 Times of liftoff and touchdown change Biggest peak : Touchdown far down in tail 2011 Waters Corporation29 Concentration Change:Zoom In Focus on 1/10 peak Middle peak : Touchdown is well positioned 2011 Waters Corporation30 Concentration Change:Zoom In Again Focus on 1/100 peak Smallest peak : Touchdown is high up the tail Relative area of smallest peak is reduced! 2011 Waters Corporation31 Concentration Change:ApexTrack Height ratios of 1: 1/10 : 1/100 Liftoff is the same for each peak .
9 Touchdown is the same for each peak Biggest peak : Touchdown is well positioned 2011 Waters Corporation32 Concentration Change:Zoom In Focus on 1/10 peak Middle peak : Touchdown is well positioned 2011 Waters Corporation33 Concentration Change:Zoom In Again Focus on 1/100 peak Smallest peak : Touchdown is well positioned Note different slope thresholds 2011 Waters Corporation34 Changing %Touchdown Focus on Big peak A small change in the %Touchdown will have a big impact on the slope for the big peak because it is a percentage of the peak height This will have very little effect on the middle peak and NO effect on the small peak 2011 Waters Corporation35 Apex Track Integration Timed Events ANP -Allow Negative Peaks DS -Detect Shoulders GS -Gaussian Skim TS -Tangential Skim II -Inhibit Integration MP -Merge Peaks (for GPC only) SL% -Set Liftoff % ST% -Set Touchdown % SMA -Set Minimum Area SMH -Set Minimum Height SMxH -Set Maximum Height SMxA -Set Maximum Area VV -Valley-to-Valley SPW -Set peak Width SDT -Set Detection Threshold 2011 Waters Corporation36 Integration eventsComparison.
10 Traditional Apex Track 2011 Waters Corporation37 ConclusionsAdvantages over other Integration parameter determination, for rapid method parameters superior to those of Detection , for reproducible Detection of difficult peaks and adjusted slope threshold, for accurate baseline determination, does not affect peak Skimming 2011 Waters Corporation38 System Suitability Calculations 2011 Waters Corporation39 System Suitability TabNew in Empower3 2011 Waters Corporation40 2011 Waters Corporation41 Setting System Suitability Limits 2011 Waters Corporation42 2011 Waters Corporation43 Noise & Drift Calculations 2011 Waters Corporation44 Empower Noise and Drift Calculations There are 8 different calculations that can be performed: Detector Noise peak -to- peak Noise Detector Drift Average Detector Noise Average peak -to- peak Noise Average Drift Baseline Noise Baseline Drift 2011 Waters Corporation45 Enabling 2011 Waters Corporation46 Visual Representation of the Least-squares line 2011 Waters Corporation47 Detector Drift Detector drift is the slope of the least-squares line.