Transcription of Optimizing Cluster Density on Illumina Sequencing Systems
1 Optimizing Cluster Density on Illumina Sequencing SystemsUnderstanding Cluster Density limitations and strategies for preventing under- and of ContentsI. Introduction 3II. Understanding Optimal Cluster Density 3a. How Does Overclustering Affect Sequencing Data? 3 III. How to Diagnose Overclustering with Sequencing Analysis Viewer 3a. The Analysis Tab 3b. The Imaging Tab 5c. The Summary Tab 7IV. Common Causes of Under- and Overclustering and Strategies for Prevention 7a. Library Quality 7b. Library Quantification 8c. Flow Cell Loading 8d. Library Nucleotide Diversity 8V. Summary 10VI. Glossary 10 VII. References 10 3 I.
2 IntroductionThe Illumina Sequencing workflow is based on 3 simple steps: libraries are prepared from virtually any nucleic acid sample, amplified to produce clonal clusters, and sequenced using massively parallel synthesis. The Density of clonal clusters has a large impact on Sequencing performance in terms of data quality and total data output. This primer discusses the principles of optimal Cluster Density , how to diagnose overclustering, and common causes and strategies for the prevention of overclustering on Illumina Sequencing Systems . II. Understanding Optimal Cluster DensityCluster Density is a critically important metric that influences run quality, reads passing filter, Q30 scores, and total data output.
3 While underclustering maintains high data quality, it results in lower data output. Alternatively, overclustering can lead to poor run performance, lower Q30 scores, the possible introduction of Sequencing artifacts, and counterintuitively lower total data output. Performing a run at optimal Cluster Density involves finding a balance between under- and overclustering. The goal is to sequence at high enough densities to maximize total data output, while maintaining low enough densities to avoid the negative effects of overclustering. a. How Does Overclustering Affect Sequencing Data?Overclustering creates image analysis problems, including loss of focus, poor template generation, and issues with Cluster registration.
4 The increased overall signal brightness of the flow cell makes it difficult for the sequencer to find the appropriate focal plane. Together these challenges act on Sequencing data in the following ways: Lower Q30 Scores Due to overloaded signal intensities, the ratio of base intensity to background for each base is decreased. This decrease often results in ambiguity during base calling, and leads to a decrease in data quality. Lower Clusters Passing Filter The percentage of clusters passing filter (%PF) is an indication of signal purity from each Cluster . Overclustered flow cells typically have higher numbers of overlapping clusters.
5 This leads to poor template generation, which then causes a decrease in the %PF metric. Lower Data Output Reduced yield (gigabases [Gb] per flow cell) is a byproduct of lower %PF. Inaccurate Demultiplexing Index reads usually have low diversity by design, which can lead to poor base calling. Overclustering exacerbates the potential for poor base calling, which in turn, can lead to demultiplexing failures. Complete Run Failure In cases of extreme overclustering, focusing can fail and the run may terminate at any How to Diagnose Overclustering with Sequencing Analysis ViewerCluster Density can influence many aspects of Sequencing data.
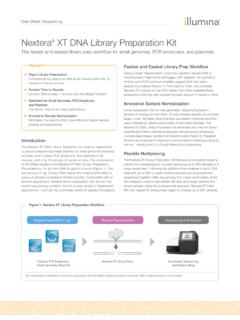
6 Therefore it is helpful to understand and recognize how overclustering can be detected using real-time run metrics. Several features in the Illumina Sequencing Analysis Viewer (SAV) can be used to diagnose The Analysis TabData by Cycle: IntensityIf severe intensity drops occur in all channels early in the Sequencing run, it can indicate poor template generation due to overclustering (Figure 1). The software would be unable to extract intensity information from subsequent images resulting in midrun failure. 4 Data by Cycle: % > Q30 Intensity drops and/or lower Q30 scores are the most common ways overclustering can be detected.
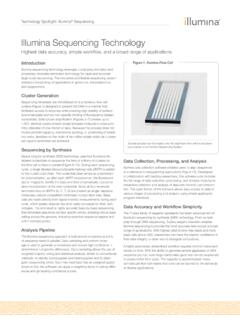
7 Overclustering can affect either Read 1 or Read 2, but Read 2 is commonly more severely affected. This is because during paired-end (PE) chemistry, Cluster sizes increase slightly due to extra cycles of amplification, which can lead to an increase in the number of overlapping clusters. With overclustered flow cells, this can affect run image registration and lead to poor Q30 scores and possible run failures (Figure 2). 1A1 BFigure 1: Data by Cycle: Intensity. A) Intensity profile from a normally clustered flow cell. B) Intensity plot shows midrun failure due to an overclustered flow 2: Data by Cycle: % > Q30.
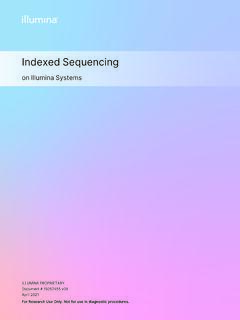
8 A) % > Q30 profile from a normally clustered flow cell. B) % > Q30 profile shows large standard deviations leading to a run failure due to an overclustered flow by Lane: DensityData by Lane: Density box plots compare the raw Cluster Density to the %PF Cluster Density (Figure 3). With optimal Density , the raw Cluster Density and %PF box plots appear close to one another (Figure 3A). As the Cluster Density increases beyond optimal Density , the %PF decreases and the box plots appear further apart (Figure 3B). Also, clusters will not be identified correctly, which can result in underestimation of the raw Cluster Density .
9 With severe overclustering, no clusters passed filter and the %PF plot is displayed as a green line at 0 Density (Figure 3C).ABCF igure 3: Data by Lane: Density . The blue boxes illustrate the raw Cluster Density range, the green boxes illustrate the %PF Cluster Density range, and the red lines indicate the median Cluster Density values. A) Optimal Density . B) Overclustered. C) Severely overclustered. 5 Flow Cell ChartFlow cell charts are useful for visualizing data per tile across the flow cell. Setting the first drop-down field for Density PF shows the range of Cluster densities across all tiles of the flow cell.
10 The figure legend (ie color scale) provides color coding for easy identification of Density levels per tile. The color scale will change from run to run; therefore, it is important to reference the values in the scale when assessing Cluster Density . With optimal Density , the legend displays Cluster Density values within the recommended range (Figure 4A, lane 2). Overclustered flow cell charts have tiles at the higher end of the color range and can include blue tiles (Figure 4A, lane 1). The blue color represents tiles that have low intensity or tiles that have dropped out (intensities = 0) due to image extraction failure.