Transcription of Optimizing Picking Performance - Fortna
1 White PaperOptimizing Picking Performance through Proper Sizing of Pick report is provided to you courtesy of Fortna Inc., a leader in developing and delivering successful distribution strategies and engineered solutions. For additional information about how Fortna can help your company, please call us at (800) Fortna -1 or visit our Web site: Many industry professionals spend much of their time and money concentrating solely on implementing the newest technologies to improve efficiencies in their distribution operation. Technology can be a huge investment in time and money and also may not address more easily corrected factors affecting productivity.
2 In some cases, the most effective means to increase efficiencies across both replenishment and Picking operations is through the proper sizing of pick locations. Especially, in instances where an operation inherits equipment from either previous product lines or a leased distribution center, these operations are frequently equipped with unsubstantiated quantities of carton flow, bin shelving, and pallet pick locations. Regardless of the situation, an analysis and implementation of the proper size of pick and reserve media for your distribution center will yield information that can dramatically improve replenishment and pick productivity. The multi-stage process begins by determining the average daily shipping volume of each SKU.
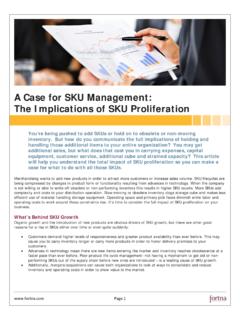
3 It is best to have a year s worth of data to identify key seasonality trends and strengthen result accuracy. However, if a year s worth is not available, use the longest historical period possible. Also, if your business is consistent and has little fluctuation in demand, then three to four months of order data will be sufficient for this analysis. Figure A: % for each year of planning horizonEstimated order growth# of days inventory in forward pick locationsDays on hand inventory% for each year of planning horizonEstimated SKU growthMonths or YearsPlanning horizonDetailTarget FiguresSKU dimensions (if case not available)Pallet length, width, heightCase length, width, heightDimensional dataSKU's in orderUnits per lineLines per order# of ordersHistorical shipping dataDetailRequired Data% for each year of planning horizonEstimated order growth# of days inventory in forward pick locationsDays on hand inventory% for each year of planning horizonEstimated SKU growthMonths or YearsPlanning horizonDetailTarget FiguresSKU dimensions (if case not available)
4 Pallet length, width, heightCase length, width, heightDimensional dataSKU's in orderUnits per lineLines per order# of ordersHistorical shipping dataDetailRequired Data Next, use accurate case dimensions for each SKU to convert the daily shipping averages to a cubic volume for each SKU. If case dimensions are unavailable, use accurate SKU dimensions instead. Furthermore, determine the average days on hand (DOH) inventory desired in each pick location. This is a key number affecting the efficiency of replenishment and Picking . Placing excessive inventory levels in pick locations will help keep replenishment frequencies low but will also result in a pick area that utilizes too much warehouse space and creates more travel time for pickers.
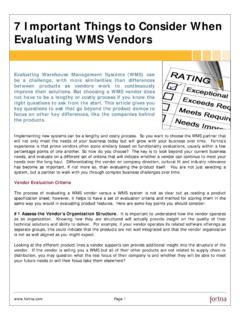
5 If a target is not known for days on hand in the forward pick locations, a good number to start with is 10 days. This number can be adjusted throughout the process, if necessary. The space requirement for each SKU in a pick location can now be computed by multiplying the average daily cubic volume and the first pass of the DOH inventory in forward pick locations. It s a good idea to add a 10% operational buffer to account for any fluctuations due to new SKU s, seasonality, etc. Figure B: , , , ACubic req'dw/ 10% bufferCube (ft) req'd in forward pick (in) req'd in forward pick per caseCubic volume (in) per case Target daily , , , ACubic req'dw/ 10% bufferCube (ft) req'd in forward pick (in) req'd in forward pick per caseCubic volume (in) per case Target daily volume Next, factor in order growth over the planning horizon; If the distribution center will support an increasing percentage of customers over the planning horizon, the analysis must account for this volume growth.
6 The increased output will mean the DOH inventory in each pick location will decrease over time. Since one of the primary goals is to increase replenishment s efficiency, don t allow DOH inventory in pick locations to become too small by the end of the planning horizon. This will negatively impact replenishment productivity by increasing the number of required replenishments each day. Now, determine how these DOH cubic volumes fit best into the various types of pick media. The most common types of pick media include bin shelving, carton flow and wire deck, each with adjustable bin sizes. Vertical carousels, horizontal carousels, and all other types of pick media can also be included in the analysis.
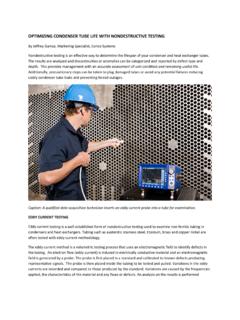
7 Determine the cubic capacity of each pick bin and match it with the appropriate SKUs in the analysis by not exceeding the SKU s cubic requirements. Figure C: SKU A's recommended media x 40L x 60hPallet x 26h x 30dWire x 14h x 100dSKU B's recommended media x 14h x 100dCarton x 14h x 24dSKU C's recommended media x 14h x 24dSKU D's recommended media x 14h x 24dCubic (ft) CapacityCubic (in) CapacityBin ShelvingSKU A's recommended media x 40L x 60hPallet x 26h x 30dWire x 14h x 100dSKU B's recommended media x 14h x 100dCarton x 14h x 24dSKU C's recommended media x 14h x 24dSKU D's recommended media x 14h x 24dCubic (ft) CapacityCubic (in) CapacityBin Shelving From Figure 2, SKU D s cubic requirement, at a 10 day DOH inventory goal, is ft3.
8 Since the smallest pick face is a 6 x14 x24 bin location with ft3 of capacity, 10 days of inventory will easily fit into the smallest bin size. In fact, there is enough space to fit over 20 days of inventory into this forward pick location. However, since it is the smallest bin available, SKU D must go into this pick type. Additionally, SKU B has a cubic requirement, at a 10-day inventory goal, of Since the smallest bin size, a 6 x14 x24 bin location, can only accommodate of inventory, SKU B will have to be located in the next larger size bin location a 12 x14 x24 bin location. Always place SKUs in a pick bin capable of handling its cubic velocity requirements, hence ensuring the desired efficiency improvements by not jeopardizing the forward pick DOH goals.
9 Proceed with this process for every SKU until each SKU has been placed in its appropriate sized media type. Finally, ensure each SKU is capable of fitting into the selected media type. For example, if the case dimensions for SKU D are 40 x 1 x 1 , it will not fit easily into any bin shelving locations. There are not any bin shelf locations capable of handling a 40 long item. For such circumstances, SKU D will have to move into the first type of media capable of handling its dimensions, 12 x 14 x 100 carton flow rack. After placing each SKU in a specific media type, the total quantity required of each media type is known. Now is a good time to factor in SKU growth.
10 Assuming future SKUs are going to be similar in size and volume to current SKU s, increase the specific media types equal to the expected annual SKU growth levels. If no SKU growth is expected throughout the planning horizon, then no adjustments need to be made to the quantities of pick media. Figure D: 25242448w x 40L x 60hPallet Location18217917548w x 26h x 30dWire Deck15615315024w x 14h x 100d25525024512w x 14h x 100dCarton Flow23222722324w x 14h x 24d31230630012w x 14h x 24d3233163106w x 14h x 24dBin ShelvingBase Yr+2 QtyBase Yr+1 QtyBase Yr QtyAnnual SKU growth = 2%25242448w x 40L x 60hPallet Location18217917548w x 26h x 30dWire Deck15615315024w x 14h x 100d25525024512w x 14h x 100dCarton Flow23222722324w x 14h x 24d31230630012w x 14h x 24d3233163106w x 14h x 24dBin ShelvingBase Yr+2 QtyBase Yr+1 QtyBase Yr QtyAnnual SKU growth = 2% The final step in the process is to plot the new pick media in the current warehouse configuration.