Transcription of ORIGINAL RESEARCH The run chart: a simple …
1 The run chart : a simple analytical toolfor learning from variation inhealthcare processesRocco J Perla,1 Lloyd P Provost,2 Sandy K Murray3 Background:Those working in healthcare today arechallenged more than ever before to quickly andefficiently learn from data to improve their services anddelivery of care. There is broad agreement thathealthcare professionals working on the front linesbenefit greatly from the visual display of datapresented in time :To describe the run chartdan analytical toolcommonly used by professionals in qualityimprovement but underutilised in :A standard approach to the construction, useand interpretation of run charts for healthcareapplications is developed based on the statisticalprocess control :Run charts allow us to understandobjectively if the changes we make to a process orsystem over time lead to improvements and do so withminimal mathematical complexity. This method ofanalyzing and reporting data is of greater value toimprovement projects and teams than traditionalaggregate summary statistics that ignore timeorder.
2 Because of its utility and simplicity, therun chart has wide potential application inhealthcare for practitioners and charts also provide the foundation for moresophisticated methods of analysis and learning suchas Shewhart (control) charts and skills associated with using data forimprovement vary widely among thoseworking to improve healthcare. We describea simple analytical tool commonly used byprofessionals in quality improvement, butunderutilised in healthcaredthe run those health professionals that use runcharts, they provide a valuable source ofinformation and learning for both practi-tioner and patient. The following scenariodescribed by Neuhauser and Diaz2providesone example of the simplicity of run chartsand their potential for wide application inhealthcare:Susan Cotey is a diabetes educator at HuronHospital in Cleveland, Ohio. She gives outgraph paper to elderly diabetic patients wholive in the most impoverished part of her uses a self-help book designed specifi-cally for her patients.
3 Each patient getsa copy. She asks them to plot their bloodsugar measures over time, connect the dotsand bring their graphs in to small discussiongroups of similar patients who share theirexperience and learn about diabetes self-management (diet, exercise, weightcontrol). Nearly every patient brings in theirgraph. The large majority of patientsimprove their diabetic control. This hospitalhas made diabetes management a centre ofits healthcare use of run charts by these patients withdiabetes summarises the spirit of our paperdthe run chart has a role to play in healthcareimprovement many healthcare professionalsnow recognise the value of statistical processcontrol methods, applications and tools inimproving the quality of care, much of thisfocus in the healthcare improvement litera-ture is on Shewhart (control) charts andtheir various derivatives (such as cumulativesummation charts and funnel plots).3 Verylittle has been written about the use andapplication of run run chart allows us to learn a great dealabout the performance of our process withminimal mathematical complexity.
4 Specifi-cally, it provides a simple method to determineif a process is demonstrating non-randompatterns, what we term a signal . By focussingon the time order that data are collected, therun chart can be applied when traditionalmethods to determine statistical significance(t-test, chi-square, F test) are not uses of the run chart for improve-ment activities include the following4:<An additional text box ispublished online only. Toview this file please visit thejournal online ( ).1 UMass Memorial HealthCare, Worcester,Massachusetts, USA2 Associates in ProcessImprovement, Austin, Texas,USA3 Corporate TransformationConcepts, Eugene, Oregon,USAC orrespondence toDr Rocco J Perla, Office ofQuality and Patient Safety,Center for Innovation andTransformational Change, 22 Shattuck Street, Worcester,MA 01605, USA; 26 July 201046 BMJQualSaf2011;20:46e51. RESEARCH on April 8, 2011 - Published by from <Displaying data to make process performance visible<Determining if changes tested resulted in improve-ment<Determining if we are holding the gains made by ourimprovement<Allowing for a temporal (analytic) view of data versusa static (enumerative) viewDisplaying data on a run chart is often the first step indeveloping more complex Shewhart (control) charts45and in the design of planned thispaper, we briefly outline the construction, interpretationand use of run AND CONSTRUCTION OF A RUN CHARTA run chart is a graphical display of data plotted in sometype of order.
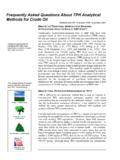
5 The horizontal axis is most often a timescale (eg, days, weeks, months, quarters) but could alsoinclude sequential patients, visits or procedures. Thevertical axis represents the quality indicator beingstudied (eg, infection rate, number of patient falls,readmission rate). Usually, the median is calculated andused as the chart s centreline. The median is requiredwhen using the probability-based rules to interpret a runchart (see below). The median is used as the centerlinebecause (1) it provides the point at which half theobservations are expected to be above and below thecenterline and (2) the median is not influenced byextreme values in the data. Goal lines and annotations ofchanges and other events can also be added to the 1shows an example of a run chart . As shownin figure 1, the run chart helps us understand and visu-alise the impact of different interventions and tests ofchange over time. To determine objectively when thesedata signal a process improvement, we use the medianand run chart rules described in the next primary advantage of using a run chart is that itpreserves the time order of the data, unlike statistical testsof significance that generally compare two or moreaggregated sets of data.
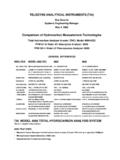
6 For example, the summarystatistic presented infigure 2lookslike there is improve-ment in the before to after data attributed to a change inthe system. Summary statistics for each of the three unitsshown infigure 2where the change was tested producethe same pre-test mean and SD (70 min, min) andpost-test mean and SD (30 min, min). Further,a t-test produced a highly significant result (t22 ,p< ). The question we want answered, however, is notwhether our change was statistically significant butwhether the change is associated with a sustainableimprovement in each unit where the change was from Unit 1 would yield the bar chart infigure 2andsupport the conclusion that we have achieved a sustain-able improvement. Data from Unit 2 would yield the samebar chart but the data here reveal that improvement wasalready occurring before the change was tested. Data fromUnit 3 would also result in the same bar chart . In Unit 3,the change did result in improvement, however, it was notsustained. Viewing data over time rather than in summarystatistics yields richer data and more accurate conclusionsfor improvement TO HELP INTERPRET A RUN CHARTWhen improvement data are presented in healthcare(eg,clinical reports, dashboards, project updates, andboard reports), people will often over- or under-react toa single or most recent data point (and begin tampering,possibly making things worse).
7 8 The terms shift and trend are often used indiscriminately on a subjectivebasis as a means for moving a conversation or decisionforward, without recognition that statistical definitionsof such terms exist and rely on more than a single datapoint. The three probability-based rules below are usedto objectively analyse a run chart for evidence of non-random patterns in the data based on anaerror ofp< Although there is nothing magical about level of significance, it provides an objective statis-tical threshold for whether changes are leading toimprovement or degradation in a process and is consis-tent with typical practice in RESEARCH . The thresholdcould be made more or less stringent based on theparticular situation, but an agreed upon approach iscritical to establish especially if many people are lookingat, and acting on, the data being presented. The rulesbelow are appropriate for quality improvement projects(where improvement is planned and expected) and havebeen shown to be effective in detecting signals in a widerange of healthcare 1dshiftSix or more consecutive pointseitherallabove or allbelow the median.
8 Values that fall on the median do notFigure 1 Example of a run chart demonstrating compliancewitha standard ;20:46e51. RESEARCH on April 8, 2011 - Published by from add to nor break a shift. Skip all values that fall on themedian and continue 2dtrendFive or more consecutive points all going up or all the value of two or more consecutive points isthe same, only count the first point and ignore therepeating values; like values do not make or break a 3drunsA non-random pattern is signalled by too fewortoomanyruns, or crossings of the median run is a seriesof points in a row on one side of the median. If onlychance is influencing the process being measured witha run chart , then there should be a regularity at whichdata points go above and below the median to satisfy thiscondition. Some points can fall exactly on the medianline, which makes it hard to decide which run thesepoints belong to. An easy way to determine the numberof runs is to count the number of times the lineconnecting the data points crosses the median and addone.
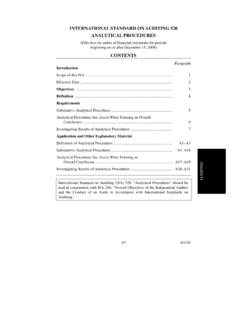
9 Tabled critical values are used to determine if toomany or too few runs exist (seetable 1). Figure 3showsan example of a run chart with too few runs, where it ispossible that an intervention is keeping the data fromdipping back down below the median which is where itwould tend to go if the data were 4dastronomical pointUsed in detecting unusually large or small numbers. Anastronomical data point is one that is obviously, evenblatantly, different from the rest of the points; allstudying the chart would agree the point is points should not be confused with thehighest or lowest data points, which every run chart willhave. While Rules 1, 2 and 3 are probability based, Rule 4is subjective and recognises the importance of the visualdisplay of the data in a run 3shows the four rules for identifying non-random signals with actual run charts. Of course theserules, like any others, can only be understood in thecontext in which they are being applied. Nevertheless,having simple and consistent guidelines to distinguishbetween random variation and non-random signals is animportant part of learning from technique in using a run chart to learn abouttheimpact of changes is to create an initial median usingbaseline data.
10 If the baseline data come from a processexhibiting no signals (shift, trend, runs, astronomicaldata point), extend or freeze this initial median intothe using the baseline data and extending themedian into the future, new data are not allowed toinfluence the initial median. Any changes in the newdata stand out against the baseline median more clearlyallowing for more accurate detection of signals ofimprovement (the probability-based rules are relative tothis median value). This is particularly important as wetry to understand the impact of different changes toa system over a small amount of data, the median (and thus theabove rules) may not be useful. The shift and run rulesrequire more than 10 points before they are 2 Summary statisticsversustime-ordered data. (Eachunit has the same 24 data valuesordered differently over time.)Cycle Time (min)SD = = )22(<p100.,.48 BMJQualSaf2011;20:46e51. RESEARCH on April 8, 2011 - Published by from But the user should decide when to calculate the medianwhen starting the run chart .