Transcription of Overview of U.S. Livestock, Poultry, and Aquaculture ...
1 1 Overview of Livestock, Poultry, and Aquaculture Production in 2017 Purpose This document is a compilation of statistics published by the National Agricultural Statistics Service (NASS) of the Department of Agriculture (USDA). Its purpose is to (1) give an Overview of livestock, poultry, and Aquaculture information for 2017, (2) compare the value of production for these animal commodities, and (3) show changes over time. Available Statistics Official statistics for livestock, poultry, and Aquaculture populations published by NASS are based on the Census of Agriculture conducted every 5 years ( , 2007 and 2012) and sample surveys conducted monthly, quarterly, or annually as determined by the particular commodity.
2 The Census of Agriculture, which is a complete enumeration of the entire agricultural segment of the economy, is the only source of detailed, county-level data of all farms and ranches in all 50 States selling or intending to sell agricultural products worth $1,000 or more in a year. Census 2012 reports are available at: The massive data-collecting, editing, and summarizing effort required to prepare the Census naturally results in a publication lag. Sample survey estimates and final Census reports rarely show exactly the same numbers. However, the ongoing sample surveys provide the most up-to-date statistics between the Census years and are themselves subject to revision when current-year estimates are made.
3 For these reasons, statistics in the 2012 Overview for 1 year compared with similar statistics published for 2012 in the 2016 Overview , may not always match. Number of Farms Estimates for the number of farms were based on the definition of a farm as any establishment from which $1,000 or more of agricultural products were sold or would be 2 normally sold during the year. In general, there were fewer farms in the western half of the United States; however, western farms and ranches were generally larger than those in the eastern half of the United States as reported by the 2012 Census of Agriculture (map 1). A higher percentage of land area in the Central United States was dedicated to land in farms.
4 In 2017, there were million farms, down slightly from 2016. Total land in farms was 910 million acres in 2017, which represents a decrease of million acres from 2016. The average farm size was 444 acres in 2017, up 2 acres from the previous year. Map 1 Relative Magnitude of Industries, by Value of Production The 2012 Census of Agriculture showed that the Central and Eastern States had a higher value of livestock and poultry compared with the Western States (map 2). In recent years, the total value of production has been split nearly equally between crop and livestock (and poultry) production. In the 2012 Census of Agriculture, percent of total value of production came from livestock and poultry.
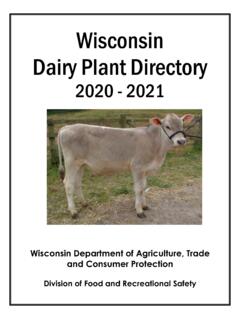
5 The coastal areas and North Central portions of the United States generally made a 3 smaller livestock and poultry contribution to the total market value. These areas had heavy concentrations of crop, fruit, and vegetable products. Map 2 Introduction to the Livestock, Poultry, and Aquaculture Industries According to the 2012 Census of Agriculture, almost one-half of the million farms in the United States had cattle and calves (913,246). (USDA defines a cattle operation as any place having one or more head of cattle on hand at any time during the year.) Only a small number of cattle operations (64,098) were dairies. There were 128,456 operations with goats, 88,338 operations with sheep, and 63,246 operations with hogs and pigs.
6 Operations with equids are counted only if they are farms (they must have $1,000 or more of sales of agricultural products), and the most recent count of those, in 2012, put the number of farms with equids at 504,795. 4 In 2017, the cattle industry had the highest value of production at roughly $ billion. The poultry industries were the next largest commodity in the United States, with production valued at around $ billion, followed by hogs and pigs at $ billion (table 1). The value of milk production was about $ billion, percent higher than in 2016. Cattle and Calves (Beef and dairy ) The Nation s million cattle and calves (beef and dairy ) are dispersed widely across the country, with a greater concentration generally in the Central States (map 3).
7 Map 3 Overall, the number of cattle and calves in the United States has increased from million in 1869, reaching a peak of million in 1975. From 2007 to 2014, the Nation s inventory of cattle and calves saw a steady decline, but has shown 4 years of increase from 2015 through 2018, to million. 5 The number of operations with cattle (or calves) has declined steadily during the past 15 years, from million in 1995 to 913,246 (2012 Census of Agriculture). The overall decline is due to the decline in number of beef operations. The decrease in the number of cattle operations is due primarily to the decline in the number of operations with fewer than 50 head of cattle (data not shown).
8 The number of operations was down for all size groups from 2007 to 2012 except for the 1 to 9 group, which was up about 10,000 operations. According to the 2012 Census of Agriculture, small cattle operations (1 49 head) accounted for percent of all cattle operations but only percent of the total inventory of cattle and calves. Large operations (1,000 or more head) accounted for just percent of all cattle operations but accounted for percent of the total inventory of cattle and calves (table 2). Milk Cows dairy On January 1, 2018, California and Wisconsin accounted for percent of the milk cow inventory. The population of milk cows has remained relatively stable over the last 10 years.
9 Over the previous decade the number of milk cows ranged from million to million (data not shown). Annual milk production per cow increased from 17,763 pounds in 1999 to 22,941 pounds in 2017, a 29-percent increase. Table 3 documents dairy production for 2016 and 2017. Beef Cows Beef cows are distributed widely across the United States. In general, however, States in the central part of the Nation have a higher number of beef cows, led by Texas ( million on January 1, 2018). Missouri, Nebraska, and Oklahoma each had about 2 million beef cows. Beef cows accounted for percent of the total cow inventory on January 1, 2018.
10 6 According to the 2012 Census of Agriculture, 727,906 operations in the United States had beef cows. The number of operations with beef cows has declined gradually since 1996 (1 2 percent per year). This decrease is most notable in the number of small operations (1 49 head) (data not shown). Cattle on Feed Cattle on feed (steers and heifers) are fed a ration of grain or other concentrate in preparation for slaughter, and the majority are in feedlots in States with large grain supplies. On January 1, 2018, three States (Kansas, Nebraska, and Texas) accounted for nearly two-thirds ( percent) of the inventory of cattle on feed in all feedlots with 1,000 or more capacity.