Transcription of PATH ANALYSIS I: INTRODUCTION - PiratePanel
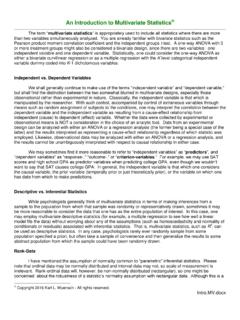
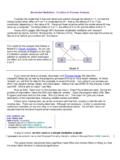
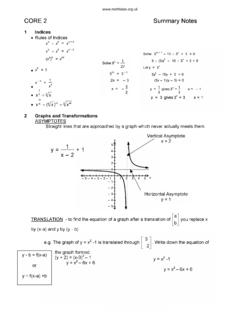
1 An INTRODUCTION to Path ANALYSIS Developed by Sewall Wright, path ANALYSIS is a method employed to determine whether or not a multivariate set of nonexperimental data fits well with a particular (a priori) causal model. Elazar J. Pedhazur (Multiple Regression in Behavioral Research, 2nd edition, Holt, Rinehard and Winston, 1982) has a nice introductory chapter on path ANALYSIS which is recommended reading for anyone who intends to use path ANALYSIS . This lecture draws heavily upon the material in Pedhazur's book. Consider the path diagram presented in Figure 1.
2 Figure 1 Each oval represents a variable. We have data on each variable for each subject. In this diagram SES and IQ are considered to be exogenous variables -- their variance is assumed to be caused entirely by variables not in the causal model. The connecting line with arrows at both ends indicates that the correlation between these two variables will remain unanalyzed because we choose not to identify one variable as a cause of the other variable. Any correlation between these variables may actually be casual (1 causing 2 and/or 2 causing 1) and/or may be due to 1 and 2 sharing common causes.
3 For example, having a certain set of genes may cause one to have the physical appearance that is necessary to obtain high SES in a particular culture and may independently also cause one to have a high IQ, creating a spurious correlation Copyright 2016, Karl L. Wuensch - All rights reserved. Page 2 between 1 and 2 that is totally due to their sharing a common cause, with no causal relationship between 1 and 2. Alternatively, some genes may cause only the physical appearance necessary to obtain high SES and high SES may cause high IQ (more money allows you to eat well, be healthy, afford good schools, etc.)
4 , which raises your IQ). Alternatively, the genes may cause only elevated IQ, and high IQ causes one to socially advance to high SES. In this model we have chosen not to decide among these alternatives. GPA and nAch are endogenous variables in this model -- their variance is considered to be explained in part by other variables in the model. Paths drawn to endogenous variables are directional (arrowhead on one end only). Variance in GPA is theorized to result from variance in SES, IQ, nAch, and extraneous (not in the model) sources. The influence of these extraneous variables is indicated by the arrow from EY.
5 Variance in nAch is theorized to be caused by variance in SES, IQ, and extraneous sources. Please note that the path to an endogenous variable must be unidirectional in path ANALYSIS . Were we to decide that not only does high SES cause high nAch but that also high nAch causes high SES, we could not use path ANALYSIS . For each path to an endogenous variable we shall compute a path coefficient, pij, where "i" indicates the effect and "j" the cause. If we square a path coefficient we get the proportion of the affected variable's variance that is caused by the causal variable.
6 The coefficient may be positive (increasing the causal variable causes increases in the dependent variable if all other causal variables are held constant) or negative (increasing causal variable decreases dependent variable). A path ANALYSIS can be conducted as a hierarchical (sequential) multiple regression ANALYSIS . For each endogenous variable we shall conduct a multiple regression ANALYSIS predicting that variable (Y) from all other variables which are hypothesized to have direct effects on Y. We do not include in this multiple regression any variables which are hypothesized to affect Y only indirectly (through one or more intervening variables).
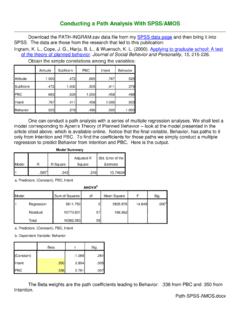
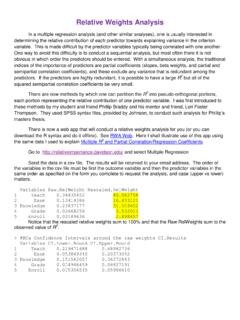
7 The beta weights from these multiple regressions are the path coefficients shown in the typical figures that are used to display the results of a path ANALYSIS . Consider these data from Pedhazur: IQ nAch GPA SES .300 .410 .330 IQ .160 .570 nAch .500 For our ANALYSIS , let us make one change in Figure 1: Make IQ an endogenous variable, with SES a cause of variance in IQ (make unidirectional arrow from SES to Page 3 IQ). Our revised model is illustrated in Figure 1A, to which I have added the path coefficients computed below. Figure 1A .009 .398.
8 416 .3 .911 .041 E3 .501 .710 E4 .954 E2 Obtain and run from my SAS Programs page. Here is the code that produced the coefficients for the model in the figure above: PROC REG; Figure_1_GPA: MODEL GPA = SES IQ NACH; Figure_1_nACH: MODEL NACH = SES IQ; Parameter Estimates for Predicting GPA Variable DF Parameter Estimate Standard Error t Value Pr > |t| SES 1 IQ 1 <.0001 NACH 1 SES 1 IQ 2 nACH 3 GPA 4 Page 4 Our diagram indicates that GPA is directly affected by SES, IQ, and nAch. We regress GPA on these three causal variables and obtain =.
9 49647, = p41 = .009, = p42 = .501, and = p43 = .416. R-Square The path coefficient from extraneous variables is R. We see that GPA is directly affected by IQ, nAch, and extraneous variables much more than by SES, but we must not forget that SES also has indirect effects (through IQ & nAch) upon GPA. We shall separate direct from indirect effects later. Parameter Estimates for Predicting nAch Variable DF Parameter Estimate Standard Error t Value Pr > |t| SES 1 IQ 1 Achievement motivation is affected by both SES and IQ in our model, and these causes are correlated with one another.
10 We regress nAch on these two causal variables and obtain = .1696, = p31 = .398, and = p32 = .041. R-Square The path coefficient from E3 to nAch is R. We see that nAch is more strongly caused by SES than by IQ, and that extraneous variables exert great influence. Now consider the path to IQ from SES. Since there is only one predictor variable in this model, the path coefficient is the simple (zero-order) r between IQ and SES, which is .300. This would also be the case if the Y variable were theorized to be affected by two independent causes (see Figure 2, in which our model theorizes that the correlation between 1 and 2 equals 0).