Transcription of PEOPLE 2020: BC Sub-Provincial Population Projections
1 PEOPLE 2020: BC Sub-Provincial Population Projections WRITTEN BY FRANK IP AND S BASTIEN LAVOIE. Introduction Projection Highlights PEOPLE 2020 ( Population Extrapolation for Organiza- It is expected that the Population will grow at a re- tional Planning with Less Error) is BC Stats' latest an- duced rate of 1% over the 2020/21 period due to the nual Population projection. This projection covers the impact of the Coronavirus Pandemic on migration to years from 2020 to 2041, with information available for an within Canada. The annual rate should then recover numerous provincial geographies including Local to during the next few years before the growth Health Area, Health Service Delivery Area, Health Au- rate gradually decline to about at the end of the thority, School District, College Region, Regional Dis- projection period.
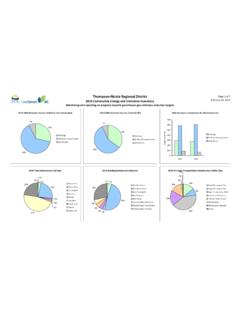
2 BC's Population is expected to in- trict and Development Region. crease from a total of 5,139,568 persons in 2020 to 6,515,558 in 2041. In this new set of BC Population Projections , all the his- BRITISH COLUMBIA Population BY DEVELOPMENT REGION. torical Population figures for all geographic types were revised significantly due to the adjustments made for Population as at Average the census-undercounting correction. As a result of July 1st annual (000s) growth this correction, BC's total Population in the year of 2016 2020- Development regions 2020 2030 2041. 2041. now shows approximately 100,000 more persons than Van Isle/Coast 893 979 1,057 the un-adjusted census figures previously reported. Mainland/Southwest 3,129 3,630 4,167 Thompson Okanagan 618 679 738 BRITISH COLUMBIA Population ESTIMATE AND PROJECTION Kootenay 169 175 177 Cariboo 169 177 181 North Coast 57 62 65 Nechako 38 45 52 Millions Northeast 66 73 78 Projection Total 5,140 5,820 6,516 Source: BC Stats The Lower Mainland, home to about 61 per cent of all the province's residents in 2020, is expected to see an Estimate average annual growth of betweeb 2020 and Population 2041.
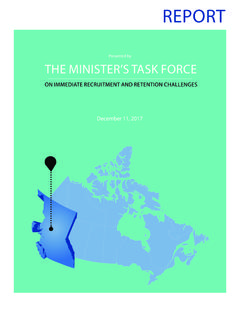
3 Mainland/Southwest along with Nechaco are the Percentage Growth two development regions in BC that will experience Population growths consistently higher than the pro- vincial level. The Northeast, Thompson-Okanagan, Source: BC Stats; Statistics Canada Vancouver Island-Coast and Northeast development BC Stats: PEOPLE 2020 2. regions will see similar Population growth but at slow growth of youth Population under the age of 20. slightly lower than provincial level, whereas the popu- years. lation changes in the Kootenay and Cariboo regions One important social-economic implication of having a will see almost no growth in the later part of the pro- declining proportion of workers in the Population is the jection periods.
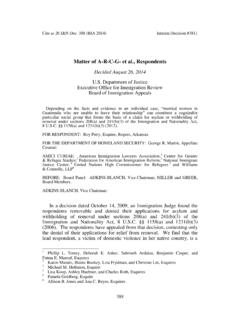
4 Change in dependency ratios in the province. Other As BC's Population continues to age, the relative por- things being equal, there will be more youths and sen- portion of senior Population will increase. In 2020, the iors depending on the producxtivity of the working number of persons aged 65 and older was estimated Population in the future. at 985,812 persons, accounting for approximately 19%. BRITISH COLUMBIA Population DEPENDENCY RATIOS. of all the residents in BC. Senior Population is pro- 2020 2041. jected to steadily increase to represent almost 25% of Youth Population (Age 0-19) 997,156 1,121,379. all BC residents (or 1,607,284 persons) in 2041. This will Senior Population (Age 65+) 985,812 1,607,284.
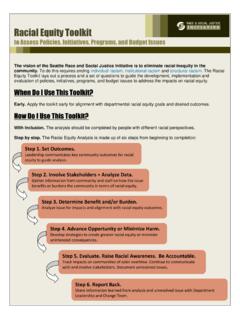
5 Working Age Population (Age20-64) 3,156,600 3,786,895. represent a 63% growth of senior Population between 2020 and 2041. Youth dependency Senior dependency BRITISH COLUMBIA Population 2020 VERSUS 2041 Total dependency 90+. 90+. Male Dependency ratio = selected group per 100 workers (age 20-64). 85 85 Female 80 80. 75 75. Source: BC Stats 70 70. 65 65. Proportionally, there will be consistently more women 60 60. 55 55 than men living in BC throughout the whole projection 50 50. 45 45 period. Population gender ratio, expressed as the 40 40. 35 35. number of men per 100 women in the Population , is 30 30. in year 2020 and is projected to decline slowly and 25 25. 20 20 steadily to in year 2041. 15 15. 2020 2020.
6 10 10. Background 2041 2041. 5 5. 0 0. 50,000 40,000 30,000 20,000 10,000 0 0 10,000 20,000 30,000 40,000 50,000. Source: BC Stats Each year BC Stats produces a new set of Sub-Provincial On the other hand, the proportion of working age pop- Population Projections by age and gender. The refer- ulation in BC will be declining slowerly over the next 20 ence date for the Projections is July 1st of that year and years. In 2020, the proportion of Population aged 20- the projection release date is usually in the early part 64 (workers) represented approximately 61% of the of the fourth quarter. Currently, the Projections are province's overall Population . However, the number of prepared for twelve Sub-Provincial geographies includ- BC workers, while increasing in number over time, will ing regional districts, local health areas, school districts be growing slower than that of the senior Population .
7 And various other administrative boundaries. The proportion of worker Population will only account for 58% of all BC residents by 2041. The dwindling Production timing of PEOPLE follows a business cycle trend of worker Population , combined with the expec- in which a set of Population estimates are first pre- tation of a relatively flat fertility trend will result in a pared for the current calendar year. These estimates are used as the base Population for Projections and BC Stats: PEOPLE 2020 3. usually published in December of each year. The devel- group , while at the same time considering the effects opment of PEOPLE Projections usually starts in the sec- of net migration, births and deaths. ond quarter of the subsequent year.
8 For this report, the The BC Vital Statistics Agency supplies BC Stats with up- 2019 estimates were produced in January 2020, while to-date data regarding vital events within the province. the Projections for 2020 onward were produced in Au- This is used to build a historic picture of births and gust of 2020. deaths at the Sub-Provincial level and is used to fore- The Sub-Provincial Population projection is controlled cast what might happen in the future. In general, vital at the aggregate level by a separate provincial level events remain realtively stable over time from a prob- Population projection. The BC-level projection sets the abilistic perspective. As such, it is expected that certain level for each component of Population growth to historical trends will continue within the foreseeable which all Sub-Provincial components should conform.
9 Future, or over the projection period. Migration on the The components are births, deaths and net migration. other hand is far more volatile and challenging to pre- dict. Government policy changes and/or regional econ- Local Heath Areas (LHAs) boundaries a health care re- omies could have a major short-term impact on migra- lated administrative region in BC are the base level of tion level or, for example, major projects started in iso- geography used in the Population projection model. All lated areas may result in a large influx of new residents other Sub-Provincial Projections are derived from the for several years. LHA Projections according to a pre-determined geo- graphic relationship. The current projection covers the BC Stats attempts to address these challenges through period 2020 to 2041 with 101 age groups (aged 0 up to careful consideration of available information.)
10 With re- 100 years old plus) and by gender (male, female and gards to assumptions for migration across the prov- total). ince, the Major Projects Inventory (MPI) 1 provides a tangible selection of large-scale infrastructure devel- Methodology opments (each over $15 million in capital costs) at var- ying stages of completion. Also, major local facility de- British Columbia small area Population Projections re- velopment or closures such as a mine closure may sult from the application of a Component/Cohort-Sur- have significant impacts on small areas in terms of vival Population model to assumptions dealing with movement of PEOPLE . Migration assumptions are revis- fertility, mortality and migration. ited annually to verify and possibly adjust previous con- siderations, due to the unpredictable nature of certain The Component/Cohort-Survival method requires sep- local economic activities.