Transcription of Performance Trust Strategic Bond Fund - ptam.com
1 Performance Trust Strategic bond Fund PT Asset Management, LLC FACT SHEET | JUNE 30, 2018. Class I Shares: PTIAX OVERALL MORNINGSTAR RATING RETURNS (%). n PTIAX n BbgBarc Aggregate bond Index n Morningstar Multisector bond Category Among 267 funds in the multisector bond category based on overall risk-adjusted returns as of June 30, 2018. FUND INFORMATION. Objective: To purchase undervalued fixed income assets and achieve investment returns 1-Year 3-Year 5-Year Since Inception (9/1/2010). through investment income and potential capital appreciation. PERCENTILE RANK IN MORNINGSTAR CATEGORY (based on total returns). Investment Process: Our expert analysts evaluate bonds by keeping one simple goal in mind income 1-Year 3-Year 5-Year Since Inception for our investors.
2 We analyze securities based on PTIAX 13 10 7 8. their future total return potential and then conduct a robust bottom-up credit screen to assess the Number of Funds in Category 327 267 208 209. bond 's potential sustainability and profitability. The result is a portfolio of securities designed to perform well in various interest rate environments over the CALENDAR YEAR RETURNS (%). long term. 2018 2017 2016 2015 2014 2013 2012. PTIAX PORTFOLIO MANAGEMENT BbgBarc Aggregate Category Average Years with Years in PTAM Industry Mike Plaiss, CFA 9 29 GROWTH OF $10,000 INVESTMENT Since Inception through June 30, 2018. Anthony Harris 9 16 n PTIAX n BbgBarc Aggregate bond Index n Morningstar Multisector bond Category EXPENSES (%) $ 17 K.
3 $ 16 K. $16,254. Expense Ratio $ 15 K. 30-DAY SEC YIELD (%). $ 14 K. $13,720. Subsidized $ 13 K. Unsubsidized $ 12 K $12,122. $ 11 K. $ 10 K. $9K. 2010 2011 2012 2013 2014 2015 2016 2017 2018. Performance data quoted represents past Performance which does not guarantee future results. The investment return and principal value of an investment will fluctuate so that an investor's shares, when redeemed, may be worth more or less than original cost. Current Performance may be lower or higher than the Performance quoted. Performance data current to the most recent month-end may be obtained at www. or by calling (866) 792-9606. PTIAX received a five star for the 3-year period (out of 267 funds), and five star rating for the 5-year period (out of 208 funds) in the multisector bond category, as of 6/30/18 based on risk-adjusted returns.
4 Performance Trust Strategic bond Fund FUND CHARACTERISTICS GLOSSARY. Alpha measures the difference between a portfolio's actual returns and its Inception Date 9/1/2010 expected Performance , given its level of risk. Bloomberg Barclays Aggregate bond Index represents securities that are taxable and dollar denominated. Net Assets Share Class $ B The index covers the US investment grade fixed rate bond market, with index Minimum Investment $2,500 components for government and corporate securities, mortgage pass through securities, and asset-backed securities. These major sectors are subdivided Minimum Initial IRA into more specific indices that are calculated and reported on a regular basis. It is not possible to invest in an index.
5 Standard Deviation depicts how widely Dividend Distribution Frequency Monthly returns varied over a certain period of time and is used to measure historical Turnover Ratio % volatility. Sharpe Ratio is a risk-adjusted measure calculated by using standard deviation and excess return to determine reward per unit of risk. The 30-Day Number of Holdings 663 SEC Yield is computed under an SEC standardized formula based on net income Alpha (3-Year) earned over the past 30 days. The Subsidized yield, which includes contractual expense reimbursements, would be lower without those reimbursements. The Standard Deviation (3-Year) Unsubsidized yield excludes contractual expense reimbursements, resulting in a lower yield.
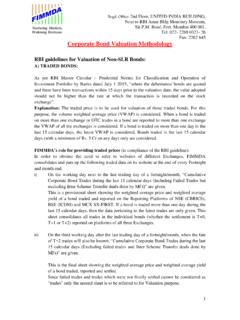
6 Sharpe Ratio (3-Year) DISCLAIMER. Mutual fund investing involves risk; principal loss is possible. Investments in debt securities typically decrease in value when interest rates rise. This risk is usually greater for longer-term debt securities. Investments in lower rated and non-rated PORTFOLIO COMPOSITION securities present a greater risk of loss to principal and interest than higher-rated securities. Investments in asset-backed and mortgage-backed securities include n Non-Agency RMBS additional risks that investors should be aware of such as credit risk, prepayment risk, possible illiquidity and default, as well as increased susceptibility to adverse n CMBS economic developments. The Fund may invest in Real Estate Investment n Taxable Municipal Trusts which involve additional risks such as declines in the value of real estate n Tax-Exempt Municipal and increased susceptibility to adverse economic or regulatory developments.
7 N Corporates Derivatives involve investment exposure that may exceed the original cost and n Treasuries a small investment in derivatives could have a large potential impact on the n Cash Performance of the Fund. Options and swap positions held in the Fund may be illiquid and the fund manager may have difficulty closing out a position. The n CLOs Fund may also invest in equities, including common and preferred stock, as a non-principal investment strategy and exchange-traded funds ( ETFs ). ETFs are subject to additional risks that do not apply to conventional mutual funds, including the risks that the market price of an ETF's shares may trade at a discount to its net asset value, an active secondary trading market may not develop or be maintained, or trading may be halted by the exchange in which they trade, which may impact the Fund's ability to sell its shares.
8 2018 Morningstar, Inc. All Rights Reserved. The information contained herein: TOP TEN HOLDINGS (1) is proprietary to Morningstar and/or its content providers; (2) may not be copied or distributed; and (3) is not warranted to be accurate, complete or timely. Neither Morningstar nor its content providers are responsible for any damages 1. US TREASURY N/B 2023/01/31 or losses arising from any use of this information. The Morningstar Rating for 2. US TREASURY N/B 2024/09/30 funds, or star rating , is calculated for managed products (including mutual funds, variable annuity and variable life subaccounts, ETFs, closed-end funds, 3. CHASE 2005-S3 A9 and separate accounts) with at least a 3-year history.
9 ETFs and open-ended 4. SONOMA PENSION OBLIG mutual funds are considered a single population for comparative purposes. It is calculated based on a Morningstar Risk-Adjusted Return measure that accounts 5. MLMI 2005-A7 2A1 for variation in a managed product's monthly excess Performance , placing more emphasis on downward variations and rewarding consistent Performance . 6. RAST 2006-A15 A10 The top 10% of products in each product category receive 5 stars, the next 7. TX PUB FIN AUTH-TXBL receive 4 stars, the next 35% receive 3 stars, the next receive 2. stars, and the bottom 10% receive 1 star. The Overall Morningstar Rating for a 8. MET DC ARPTS-BABS-AGM managed product is derived from a weighted average of the Performance figures 9.
10 HOWARD HUGHES MEDICAL IN associated with its 3-, 5-,and 10-year (if applicable) Morningstar Rating metrics. The weights are: 100% 3-year rating for 36-59 months of total returns, 60%. 10. US TREASURY N/B 2021/01/15 5-year rating/40% 3-year rating for 60-119 months of total returns, and 50%. 10-year rating/30% 5-year rating/20% 3-year rating for 120 or more months of total returns. While the 10- year overall star rating formula seems to give the most weight to the 10-year period, the most recent 3-year period actually has the greatest impact because it is included in all three rating periods. While the Fund is no-load, management fees and other expenses still apply. Please refer to the prospectus for further details.