Transcription of Persons with a Disability: Labor Force …
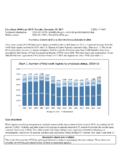
1 For release 10:00 (EDT) Wednesday, June 21, 2017 USDL-17-0857 Technical information: (202) 691-6378 Media contact: (202) 691-5902 Persons WITH A disability : Labor Force CHARACTERISTICS 2016 In 2016 , percent of Persons with a disability were employed, the Bureau of Labor Statistics reported today. In contrast, the employment-population ratio for those without a disability was percent. The employment-population ratio for both Persons with and without a disability increased from 2015 to 2016 (by percentage point for Persons with a disability and by percentage point for Persons with no disability ).
2 The unemployment rate for Persons with a disability , at percent, was little changed from the previous year, while the rate for those without a disability declined to percent. The data on Persons with a disability are collected as part of the Current Population Survey (CPS), a monthly sample survey of about 60,000 households that provides statistics on employment and unemployment in the United States. The collection of data on Persons with a disability is sponsored by the Department of Labor s Office of disability Employment Policy. For more information, see the Technical Note in this news release.
3 Highlights from the 2016 data: Nearly half of all Persons with a disability were age 65 and over, about three times larger than the share of those with no disability . (See table 1.) For all age groups, the employment-population ratio was much lower for Persons with a disability than for those with no disability . (See table 1.) For all educational attainment groups, jobless rates for Persons with a disability were higher than those for Persons without a disability . (See table 1.) In 2016 , 34 percent of workers with a disability were employed part time, compared with 18 percent for those with no disability .
4 (See table 2.) Employed Persons with a disability were more likely to be self-employed than those with no disability . (See table 4.) -2- Demographic characteristics Persons with a disability tend to be older than Persons with no disability , reflecting the increased incidence of disability with age. In 2016 , 47 percent of Persons with a disability were age 65 and over, compared with 15 percent of those with no disability . Women were more likely to have a disability than men, and Blacks and Whites had a higher prevalence of disability than Asians and Hispanics. (See table 1.) Employment In 2016 , the employment-population ratio for Persons with a disability increased from percent to percent.
5 For those with no disability , the ratio increased from percent to percent. The lower ratio among Persons with a disability reflects, in part, the older age profile of Persons with a disability ; older workers are less likely to be employed regardless of disability status. However, across all age groups, Persons with a disability were much less likely to be employed than those with no disability . (See tables A and 1.) Among Persons age 16 to 64, the employment-population ratio rose for both Persons with a disability ( percent) and those without a disability ( percent) from 2015 to 2016 .
6 The ratio for Persons age 65 and over with a disability , at percent, increased in 2016 , while the ratio for Persons without a disability , at percent, changed little. (See table A.) Persons with a disability are less likely to have completed a bachelor s degree or higher than those with no disability . Among both groups, those who had attained higher levels of education were more likely to be employed than those with less education. Across all levels of education in 2016 , Persons with a disability were much less likely to be employed than were their counterparts with no disability . (Educational attainment data are presented for those age 25 and over.)
7 (See table 1.) Workers with a disability were more likely to be employed part time than those with no disability . Among workers with a disability , 34 percent usually worked part time in 2016 , compared with 18 percent of those without a disability . The proportion of workers who were employed part time for economic reasons continued to be slightly higher among those with a disability than among those without a disability (6 percent versus 4 percent). These individuals were working part time because their hours had been cut back or because they were not able to find a full-time job. (See table 2.)
8 In 2016 , Persons with a disability were more concentrated in service occupations than those with no disability ( percent, compared with percent). Workers with a disability were more likely than those with no disability to work in production, transportation, and material moving occupations ( percent, compared with percent). Persons with a disability were less likely to work in management, professional, and related occupations than those without a disability ( percent, compared with percent). (See table 3.) The proportion of Persons employed in government was about the same for both Persons with a disability and Persons without a disability in 2016 ( percent and percent, respectively).
9 However, a smaller share of workers with a disability were employed as private wage and salary workers ( percent), compared with those with no disability ( percent), and a larger share were self-employed than were those with no disability ( percent versus percent). (See table 4.) -3-Unemployment The unemployment rate for Persons with a disability was percent in 2016 , about twice that of those with no disability ( percent). (Unemployed Persons are those who did not have a job, were available for work, and were actively looking for a job in the 4 weeks preceding the survey.) The unemployment rate for Persons with a disability was little changed over the year, while the rate for Persons without a disability declined by percentage point to percent in 2016 .
10 (See tables A and 1.) Among Persons with a disability , the unemployment rates were similar for both men and women in 2016 ( percent and percent, respectively). The rates for both men and women changed little from 2015 to 2016 . Jobless rates for Persons with a disability also showed little change among major race and ethnicity groups in 2016 . As is the case among Persons without a disability , the jobless rate for those with a disability was higher for Blacks ( percent) than for Hispanics ( percent), Asians ( percent), and Whites ( percent). (See table 1.) Not in the Labor Force Persons who are neither employed nor unemployed are not in the Labor Force .