Transcription of Phase Transformations in Nickel-Base Superalloys
1 Phase Transformations IN Nickel-Base Superalloys J. R. Mihalisin and D. L. Pasquine Abstract A study has been made of the Phase Transformations that occur during long time rupture testing of IN-731X, an alloy specifically designed for Phase stability. No sigma, formation was observed in this alloy. The beneficial effect of heat treatment in inhibit- ing sigma formation and the anomalous effect of heat treat- ment on the rupture properties of alloy 713C and alloy 71 JLC have been correlated with microstructural alterations induced by heat treatment. A method for electron vacancy calculation has been devised which incorporates the actual y' chemistry obtained by preferential extraction techniques and chemical analysis. I This method is used to show that long time rupture testing and heat treatment have little effect on electron vacancy number. J. R. Mihalisin and D. L. Pasquine are with The International nickel Company, Inc., Paul D.
2 Merica Research Laboratory, Sterling Forest, Suffern, New York 10901 134 INTRODUCTION A recent study(l) has shown how compositional modification of IN 100 alloy leads to freedom from sigma formation. A new alloy, IN-731X, has been developed which incorporates these changes without sacrificing IN 100 alloy properties. The above study also revealed that a certain heat treatment reduced sigma susceptibility in alloy 713C and alloy 713LC. However, this treatment had an anomalous effect on properties; being beneficial for alloy 713LC, but detrimental to alloy 713 Cls 1500 F rupture strength. In the present study, the Phase Transformations in IN-731X have been delineated. The effect of heat treatment on the Phase Transformations and Phase morphology in alloys 713C and 713LC have been correlated with properties. The electron vacancy concept was used in these investigations but was extended beyond its usua, 1 simplifying assumptions by employing actual y' Phase co-mpositions.
3 EXPERIMENTAL PROCEDURE, Phase Transformations were studied by light and electron microscopy and x-ray diffraction. Specimens for light microscopic examination were prepared by conventional grinding and polishing followed by etching with glyceregia (2:l HCl/HNOz + 3 glycerine by volume). Photomicrographs of stress rupture specimens were taken adjacent to the fracture. Negative replicas for electron microscopy were taken from surfaces electropolished with a of 15s HzS04 in methanol and etched in glyceregia. X-ray diffraction studies of carbide :jrrere made from residues electrolytically extracted in 10% HCl in methanol. The y' Phase was ele ctrolytically extracted in a solution of 20% H 3P04 in Hz0 and was show-n, by x-ray diffrac- tion examination, to be free of contamination from other phases . The composition of the y' Phase was determined by wet chemical analysis. X-ray diffraction studies iron-filtered CoKcl radiation. X-ray patterns using a goniometer speed of 1/2"/minute.
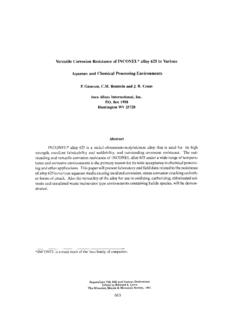
4 The counter and pulse analyzer operated at of 10 volts and a channel width of 12 volts. was calibrated with a powdered gold standard. were made with were recorded scintillation a heig'ht The RESULTS AND DISCUSSION I. Alloy IN-731X . The results of stress rupture tests on IN-731X in the temperature range of 1350'F to-1900'F are shown in Figure 1. The material was tested &s cast and with two grain sizes, The coarse grains averaged l/4" diameter while the fine grains averaged l/8 in diameter. The chemical c'omposition of this heat is given in Table I which also shows the compositions of the other heats used in this study, A compilation of the various phases electrolytically extracted from some of the test specimens of Figure 1 is given in Table II. In the "as cast" condition the major seconda;y Phase is MC carbide With a lattice parameter equal to This value is in excellent agreement with previous parameter data for pure'TiC (2).
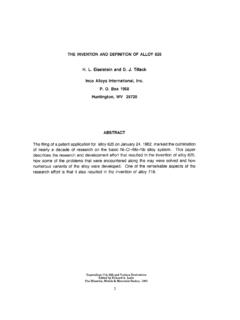
5 The major Phase change taking place in the alloy is a gradual formation of M23Ce carbide in the temperature range of 1350 F to 1900'F. This change is time- temperature dependent. At 1350'F M23Cs formation takes a longer time than at 1900'F. Also, data at l8OO-lgOO"F, the M at least as shown by the 23 C 6 carbide forms at the expense of the MC carbide. There is little change in the lattice para- meters of these phases under the test conditions employed. In addition, the Phase Transformations are identical in both coarse- and fine-grained alloys. Figure 1 shows that the coarse grain condition results in a higher rupture strength in the 1800 to lgOO F region; the effect becoming most prominent at 1900'F. At 1700'F the fine grain alloy has a higher rupture strength whereas little effect of grain size on strength is noticed at 1350 and 1500 F. The grain boundary morphology is similar for both coarse and fine grain alloys as shown by the micrographs of Figure 2 for specimens tested at 1800'F: It seems likely therefore that the higher strength of the coarse grain material at higher temperature is simply a grain size effect unrelated to the Phase Transformations taking place.
6 An electron vacancy computation, mv (ref), yields a value of This method of ??v computation is given. in Appendix I and will be referred to as fiv (ref) throughout this discussion. This method of electron vacancy computation has been agreed upon as the standard method to be used for compar- ison purposes at the International Symposium on Structural Stability at Seven Springs, Pennsylvania. for the alloys are listed in Table I). (mv (ref) values Alloys with gv numbers less than about are considered not to be prone to sigma formation. However, sigma has been found in alloys of the Alloy 713C type with NV numbers as lovr as (l). No sigma was detected in the IN-731X alloy studied here. 136 The most questionable assumption made in conventional Nv computations lies in the treatment of the y' precipitation. First of all, it is usually assumed that all aluminum and titanium in the alloy is used to form y', (Nia(A1, Ti)). From a consideration of simple Ni-Al-Ti allays(3) (upon which system complex Superalloys are based), it can readily be seen that aluminum and titanium are actually partitioned between the y and y' phases as y' precipitates from y.
7 In addition, the y' Phase in Superalloys has some solub'ility for many other alloying additions, as demonstrated by Guard and Westbrook(4). When these effects are taken into account, it is clear that the residual matrix composition would differ from that obtained by assuming that y' is simply Ni3 (Al, Ti) and that it con- sumes the total aluminum-titanium content of the alloy. This, of course, would markedly affect the Nv number of the alloy, since the residual matrix composition after precipitation has taken place is-used to calculate this number. The chemical composition (in atomic percent) of the y' Phase extracted from an as-cast specimen of IN-731X is given in Table III. The results are an average of two separate determinations. The mean deviation of these from the average is also given, The largest variations are in the aluminum and titanium contents, and this is probably an indication of microsegregation. As can be seen, the r ' Phase has solubility for a number of elements.
8 Earlier work '1) indicated that cobalt would inhabit nickel sites in the y' (Ni3Al) Phase , while Cr and MO would tend to occupy both nickel and aluminum sites. Titanium and vanadium tend to occupy aluminum sites. Using this as a basis, a formula: fNi Co Cr MO 'i Al Ti V Cr MO \ ,880 .079 .034 .009;'3 .613 .331 .023 .023 .OlO can be deduced for the y' composition given in Table III. The distribution of chromium and molybdenum between nickel and aluminum sites above is not arbitrary. Measurements of the degree of long range order indicate that chromium and molybdenum inhabit nickel sites in a ratio of approximately four to one. Any remaining chromium and molybdenum occupy aluminum sites. In any event, this is not a critical point in the discussion to follow since it only affects the calcula- tion of the density of the y' Phase and the effect is small because of the small amounts of chromium and molybdenum involved.. Knowing the composition and volume percentage of y' in the alloy and the density and composition of the alloy, a determination,can be made of the residual matrix composition after y' precipitates from y.
9 137 This is done in the following manner: of the ith the weight element in the residual-matrix (y) is given by: (Wi)' ' (Wi) alloy - Cwi> c cr2 1MO2CG TiC + (Wi) + Cwi) Y' 1 where i = Cr, Co, MO, V, Ti, Al, and Ni alloy (Wi> = P x (unit vol) x (weight percent of i th alloy element in alloy) P alloy =. alloy (3-2 1+2C6 TiC 2(wi) and (Wi) bides are weights o\f respective car- assuming all carbon is converted to carbide and evenly divided between the two varieties. x (volume percent r') x (wgkght percent of -i element in y') b = density of y'; .F ith atoms on nickel sites x (atomic weight)i + py = Aith atoms on aluminum sites x (atomic weight)i Avogadro's Number x ao3 a0 = lattice parameter of fy' Phase . weight percent of i th element in y = (w; )? The weight percent of each element is converted to atomic percent and the formula for nv is calculated as usual: ?Tv = x(atomic percent) ith element x (N,)i Using p alloy = g/cm3, a0 = and vol $ y' = as measured on electron micrographs yields a value of z = which is significantly lower than the flv (ref) value It was noticed in making this calculation that the amount of titanium left in the residual matrix after precipi- tation was reduced virtually to zero.)
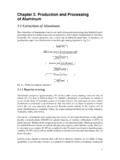
10 This suggested a method of determining the volume percent of the y' in this alloy with- out recourse to laborious lineal analysis of micrographs. could be done by using the relation: This (volume percent y') x (weight percent of ith element in the y') Assuming all titanium is consumed by yf except that amount precipitated,as TiC gives: (Weight of titanium,alloy-weight of Ti (volume percent y'),= in Tic) (Weight percent Ti in r') x p,' As seen in Table III, the volume percent y' calgulated from such determinations yields an average value of - which is in excellent agreement with the observed value of A typical area of the "as cast' structure is shown in Figure 3. The average TV value calculated using the assumption that there is no Ti in the residual matrix is also given in Table III. It appears that+the reproducibility obtainable for mv by this method is about - electron vacancy units. It should also be noted that an appreciable amount of aluminum is left in the residual matrix.