Transcription of Physiological and morphological characterization …
1 Physiological and morphological characterization of two bacillus strains Emil Ruff Abstract Organisms of the genus bacillus have been described more than 100 years ago and cultivated, engineered and used as a model system in microbiology for many decades. Despite their ubiquitous and successful use in wide areas of research and industry little was known about some of the most basic rules concerning their cell development and cell differentiation as well as biofilm and colony formation. This project describes the behaviour of two strains of bacillus under different growth conditions. The responses of the strains toward certain conditions turned out to be very different, which might be linked to their function or survival strategy within the natural environment. One strain seemed to follow the r- another the K-strategy. Furthermore, it was observed that cell motility within a colony can vary significantly depending on nutrient availability and is likely triggered at certain developmental stages of the colony.
2 Introduction Strains of the genus bacillus have been isolated for over 150 years, with the first scientific description dating back to 18721. They are aerobic endospore forming bacteria belonging to the Firmicutes that live mostly in soil, but also occur in animal guts and other environments2. bacillus species are also known to be human pathogens, which is part of the reason why they are not only well studied and understood, but also used as a widespread model system in microbiology, for cell development and spore formation3. However, it was not until recently that cell development and arrangement within bacillus colonies and biofilms has been elucidated4. Over the last ten years many exciting findings concerning cell development5 and biofilm formation6 have been discovered, but comparatively little research has been done connecting those cell capabilities to ecosystem function and microbial ecology. This project was aimed at describing cell physiology and colony morphology in relation to different nutrient and agar conditions.
3 Observing responses of the organisms toward these conditions might reveal some information about their metabolic capabilities or life styles. Materials and Methods Sampling and isolation 2 g of soil from Bell Tower Field was suspended in 10 ml ultrapure water (18 M - Milli-Q) by thorough vortexing and incubated at 80 C for 10 min. 100 l each of four dilutions (10-1 10-4) of this suspension were plated on Nutrient agar plates (Difco) and incubated at 30 C over night ( ). 12 colonies were chosen according to their colour and morphology, restreaked for isolation on Nutrient agar plates and incubated at 30 C This procedure was repeated to assure isolation of clonal strains. Cultivation media Normal LB broth: LB powder (Difco) in Milli-Q ( yeast extract, 1% NaCl, 1% peptone from casein) Low nutrient LB broth: % LB powder (Difco) in Milli-Q Cultivation plates Nutrient agar plates: sodium chloride (NaCl) Peptone yeast extract agar (Difco) Low agar/ high nutrient (LAHN) plates: 1% agar LB powder (Difco) Low agar/low nutrient (LALN) plates: 1% agar LB powder Low agar/double nutrient (LADN) plates: 1% agar 5% LB powder High agar/low nutrient (HALN): agar LB powder High agar/high nutrient (HAHN) agar, LB powder Cell counts and growth rates Cell numbers in l of liquid cultures were assessed using a Neubauer chamber and then extrapolated to cells/ml.
4 Depending on the cell density the cultures were diluted before counting. Growth rates and doubling times of the liquid cultures were calculated using the absorption of the culture as measured by a photometer at a wavelength of 600 nm. Microscopy Colony and cell morphology, as well as size and motility, was observed and measured via binoculars (Zeiss) and microscopy (Zeiss SteREO; Zeiss ; Zeiss C-LSM 700). The pictures and movies were acquired and processed digitally using the implemented software AxioVision. Embedding, Cryo-Sectioning and Staining Bacterial cultures were cut out of agar plates using a sterile scalpel, placed in a silicon Cryo-mold and fixed in a 1 PBS solution containing 4% formaldehyde and glutaraldehyde for 1 h at RT. The fixative was removed with a pasteur pipette and the cultures washed for 30 min in 1 PBS. After removing the PBS the cultures were embedded in Tissue Tek (Sakura, CA, USA) and incubated for several hours. Then the mold was shock frozen in liquid nitrogen, transferred to -80 C for several hours and then stored at -20 C for at least another few hours.
5 Embedded colonies were sectioned with a cryo-microtome into 20 m sections and placed onto polysine-covered glass slides (Thermo Fisher Scientific Inc., Schwerte, Germany). Slides were stored at -20 C until used. Slides were stained with Alcian Blue solution ( Alcian Blue powder in 3% actic acid). The solution was dropped onto the sections, incubated for 30 min at RT and rinsed carefully twice with 1 PBS and Milli-Q. The slides were air dried, embedded in mouting medium (Citifluor:Vetashield, 4:1), that contained 1 g/ml DAPI and stored at -20 C until used. Microsensor Measuring oxygen consumption by the liquid cultures was carried out using a Microsensor system (Unisense) and the software MicOx. Measurements in mV were converted to mol/l by the software and the data processed with Xcel (Microsoft). Data Analysis The pictures taken by the microscope were processed with iPhoto ( ; Apple Computer, Inc.) and the movies animated with ImageJ ( ; ). Statistical analysis of the data was carried out using R ( ; The R Foundation for Statistical Computing) 3.
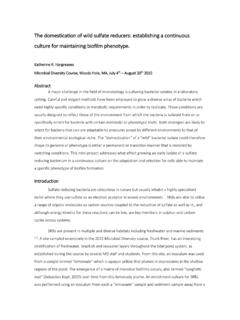
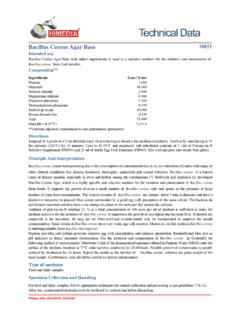
6 Results and Discussion Isolation and identification of different bacillus strains Pasteurization of 2 g soil and subsequent cultivation of the viable spores it contained, yielded 12 different colony morphotypes of aerobic spore forming bacteria. These morphotypes were isolated and their 16S rRNA amplified and identified. All 12 isolates (ASF1-12 (B11, D12, E01-E10); see Suppl. CD) belonged to the genus bacillus (Figure 1). Two of these organisms were chosen for further characterization based on their identity, cell and colony morphology. The first organism (isolate E05) was closely related to bacillus cereus (ASF6), the second one (isolate E10) was a close relative of bacillus pumilus (ASF12). Cells of ASF6 were around 10 m long and slightly motile (Figure 2a, Suppl. Movie 6_LAHN). Cells of ASF12 were around m long and highly motile (Figure 2b). Growth in liquid culture Cultivation of the two strains in liquid culture revealed significant differences concerning growth rates and metabolic capabilities.
7 Two types of growth media, a normal LB medium and nutrient depleted LB medium were prepared and each inoculated with a silmilar amount of cells (Figure 4) of one of the strains. In all Figure 1: Phylogenetic tree of the strains isolated from Bell Tower Field soil. The tree was build in ARB using the SILVA database Figure 2: Cells of the two strains as observed at 400x magnification. 2a 2b cultures cell numbers and absorbance seemed to correlate quite well (Figure 3). Within the first 3 hours after inoculation the largest change in absorbance and thus the fastest growth was observed in the high and low nutrient ASF6 culture (Fig 5, Fig 6). With 20 min and 21 min, respectively, the minimal doubling time of the organism was very similar in both conditions, although in the low nutrient condition it was delayed by one hour occuring between 5 and 6 hours after inoculation. In the nutrient depleted medium ASF6 used up most of the nutrient shortly after it entered the exponential phase.
8 The minimal doubling time of strain ASF12, although it had a longer lag phase, was similar to those of ASF6 (18 min) and surprisingly occurred under the nutrient depleted growth condition. Moreover, strain ASF12 finally grew to a higher cell density under both conditions. This suggests that the two strains have different life styles. ASF6 seems to be metabolizing fast, which might enable it to take over under high nutrient conditions out-growing its competitors. At the same time it does not cope so well with low nutrient conditions be it from the beginning, as in the low nutrient medium or when a formerly rich environment is nutritionally exploited, as in the high nutrient medium after 20 hours. Reasons for that could be found in a poor affinity to the substrate or a less efficient metabolism. This behaviour follows the r strategy, where a population is successful under favorable conditions because it is fast and produces more offsprings that other organisms. ASF12 seems to be rather a K strategist.
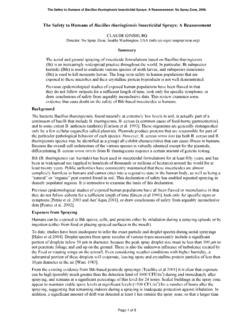
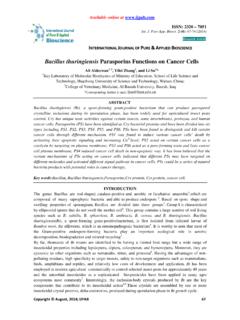
9 It might have a slower metabolism and growth rate and hence produces less offsprings in a given time, but eventually outnumbers the competitors by a more efficient use of nutrients. It seems more adapted to quality than quantity. Cell numbers in liquid culture0501001502002503003504004505003,1 4,15,16,27,17,99,2 Time (h after inoculation)Cells (x 10^6 per ml)ASF6 Low nutrie ntASF6 High nutrientASF12 Lo w nutrientASF12 High nutrie nt Figure 3: Cell counts of the liquid cultures at different time points after inoculation as assessed by the Neubauer chamber. Cell numbers in liquid culture0123456783,14,15,1 Time (h after inoculation)Cells (x 10^6 per ml)ASF6 Low nutrie ntASF6 High nutrientASF12 Lo w nutrientASF12 High nutrie nt Cell growth in liquid culture00 ,20 ,40 ,60 ,811 ,21 ,41 ,61 ,82381318232833 Time (h af ter inoculation)Absorbance (at 600 nm)ASF6 LownutrientASF6 HighnutrientASF12 LownutrientASF12 Highnutrient Growth in liquid culture-0,10,10,30,50,70,91,11,3357911 Time (h after inoculation)Absorbance (at 600 nm)ASF6 LownutrientASF6 HighnutrientASF12 Lo wnutrientASF12 Highnutrient Figure 5: Absorbance of the liquid cultures over time as measured with a spectrophotometer.
10 Figure 6: Detail of figure 5 depicting the first 5 timepoints. Figure 4: Cell numbers in the liquid cultures at the first three time points between 3 and 5 hours after inoculation. Growth on hard substrate The growth of the two strains was also observed on different hard substrates. Two agar concentrations (1% and 2,5%) were therefore combined with 3 nutrient conditions ( , and 5% LB). The diameter of the colonies was chosen as a proxy for growth and performance. 20 colonies were chosen per strain and condition and their diameter measured 3 to 4 times over the course of 72 hours. The data show marked differences between ASF6 and ASF12 that might be due to different life styles resulting from the occupation of different ecological niches. ASF6 grows significantly faster than ASF12 as shown by the slope of the regression curve that was fitted on the dataset (Figure 7). A more detailed look at the dataset reveals preferences of the strains concerning nutrient and agar concentration and indicates different strategies how the organisms cope with these growth environments (Fig lm).