Transcription of Practice Final Exam Questions (2) -- Answers
1 Practice Final Exam Questions (2) -- Answers Part A. Multiple Choice Questions . For each question, you are encouraged to give a reason or show work for partial credit. You must show your work or reason if the question is marked with an asterisk (*). 1. Confidence intervals are useful when trying to estimate _____. a. unknown parameters b. known parameters c. unknown statistics d. known statistics 2. The one-sample z statistic is used instead of the one-sample t statistic when _____. a. is known b. is unknown c. is known d. is unknown 3. The ____ the P-value, the stronger the evidence against the null hypothesis provided by the data. a. larger b. smaller 4. (*) The test statistic for a two-sided significance test for a population mean is z = What is the corresponding P-value?
2 A. b. c. d. Answer: P(Z < ) = Since this is a two-sided test, P-value is twice as much to include the other tail. * 2 = 5. The probability you reject the null hypothesis when in fact the null hypothesis is true is called _____. a. a Type I error b. a Type II error c. the power 6. (*) A random sample of 20 observations produced a sample mean of = and s = What is the value of the standard error of ? a. b. c. d. e. Answer: = 20= 7. (*) The heights (in inches) of adult males in the United States are believed to be Normally distributed with mean . The average height of a random sample of 25 American adult males is found to be = inches, and the standard deviation of the 25 heights is found to be s = A 90% confidence interval for is a.
3 B. c. Answer: The t critical value for 90% CI for df = 24 is So margin_or_error=( ) 25=( ) ( )= 8. Suppose we were interested in determining if there were differences in the average prices among two local supermarkets. We randomly pick six items to compare at both supermarkets. Which statistical procedure would be best to use for this study? a. Matched-pairs t procedure if you interpreted as same six items b. One-sample t test c. Two-sample t test if you interpreted as different six items d. None of the above 9. (*) Perform a one-sample t-test using the following statistics: n = 5 = s = The null hypothesis is = is a. accepted at the 5% level; accepted at the 1% level. b. accepted at the 5% level; rejected at the 1% level.
4 C. rejected at the 5% level; accepted at the 1% level. d. rejected at the 5% level; rejected at the 1% level. Answer: Test statistic: = = 5= Assuming a two-sided test, for df = 4, 95% CI of the t-statistic assuming H0 is [ , ] 99% CI of the t-statistic assuming H0 is [ , ] Therefore we reject H0 for alpha = but not for alpha 10. (*) You buy a package of 122 Smarties and 19 of them are red. What is a 95% confidence interval for the true proportion of red Smarties? a. ( , ) b. ( , ) c. ( , ) Answer: =19122= margin_of_error=( ) ( ) ( )122=( ) ( )= So the 95% CI is [ , + ], which yields [ , ]. 11. (*) It is thought that 12% of all students taking a particular course received a grade of A. In a sample of 155 students, it is found that 21 made an A.
5 What is the test statistic for testing the true proportion is 12%? a. b. c. Answer: =21155= = ( ) ( )155= ======================================== ================================== Part B. Short Answer Questions 1. [Textbook Exercise , ] A tablet PC contains 3217 music files. The distribution of file size is highly skewed with many small file sizes. Assume that the standard deviation for this population is megabytes (MB). a. What is the standard deviation of the average file size when you take an SRS of 25 files from this population? Answer: =325 25= b. Suppose you plan to take an SRS of n = 50 files instead. Explain why it may be reasonable to assume that the average is approximately Normal even though the population distribution is highly skewed. Answer: Because of the Central Limit Theorem (CLT), we can assume the sample mean is normally distributed when the sample size is large enough.
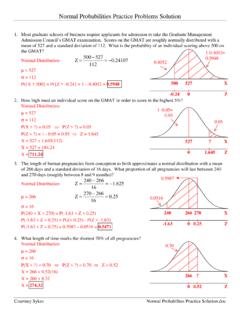
6 In this case, n = 50 is greater than 30, thus the CLT applies. 2. [Textbook Exercise ] For each of the following, answer the question and give a short explanation of your reasoning. a. A significance test for comparing two means gave t= with 10 degrees of freedom. Can you reject the null hypothesis that the s are equal versus the two-sided alternative at the 5% significance level? Answer: Probability for t = for df = 10 is between and So for two-sided test, the p-value is between and Therefore we fail to reject H0 at the significance level alpha = The graph on the left is calculated by a software. You see the exact P-value ( ). b. Answer part (a) for the one-sided alternative that the difference between means is negative. Answer: If the alternative hypothesis was Ha: 1 - 2 < 0, we can reject the null hypothesis at alpha = level because the p-value would be between and ======================================== ================================== Part C.
7 Problems 1. One-sample t-test. To test the hypothesis that eating fish makes one smarter, a random sample of 12 persons take a fish oil supplement for one year and then are given an IQ test. Here are the results: 116 111 101 120 99 94 106 115 107 101 110 92 Test using the following hypotheses, report the test statistic with the P-value, then summarize your conclusion. H0: = 100 Ha: > 100 Answer: Hypotheses: H0: = 100 (no effect -- eating fish does not help increase the mean IQ) Ha: > 100 ( effect -- eating fish helps increase the mean IQ) Test statistic: From the data, we obtain = and = .. Then we get = = . = . = .. P-value: Because n = 12, we use the t distribution with df = 11 to find the probability.
8 According to Table D, for t = for df = 11, the probability is between and Since this is a one-sided (upper-tail) test, P-value is between and Conclusion: Since values between and are < , we reject the null hypothesis at the significance level , and conclude that the fish oil supplement did make a significant increase in the mean IQ. 2. Matched one-sample t-test. The water diet requires you to drink 2 cups of water every half hour from when you get up until you go to bed but eat anything you want. Four adult volunteers agreed to test this diet. They are weighed prior to beginning the diet and 6 weeks after. Their weights in pounds are Person 1 2 3 4 mean _ Weight before 180 125 240 150 Weight after 170 130 215 152 Difference 10 -5 25 -2 7 Conduct a one-sample t-test using the difference with the following hypotheses: H0: Diff = 0 Ha: Diff 0 Report the test statistic with the P-value, then summarize your conclusion.
9 Answer: Hypotheses: H0: Diff = 0 ( no difference -- there is no difference in the mean of the weight difference) Ha: Diff 0 (difference diet made difference in the mean of the weight difference) Test statistic: From the data, we know = and = .. Then we get = = . = . = .. P-value: Because n = 4, we use the t distribution with df = 3 to find the probability. According to Table D, for t = for df = 3, the probability is between and Since this is a two-sided test, P-value is between and Conclusion: Since values between and are > , we fail to reject the null hypothesis at the significance level. We do not have enough evidence to conclude that the water diet has an impact on the weight.
10 3. Two-sample t procedure. Two different alloys are being considered for making lead-free solder used in the wave soldering process for printed circuit boards. A crucial characteristic of solder is its melting point, which is known to follow a Normal distribution. A study was conducted using a random sample of 21 pieces of solder made from each of the two alloys. In each sample, the temperature at which each of the 21 pieces melted was determined. The mean and standard deviation of the sample for Alloy 1 were x1 = C and s1 = C; for Alloy 2 the results were x2= C and s2= C. If we were to test H0: 1= 2 against Ha: 1 2, what would be the value of the test statistic?? Answer: The two-sample test statistic (for the hypothesis 1 2=0) is =( 1 2 ) 12 1+ 22 2= ( )221+( )221= + And the degrees of freedom is 21 1 = 20.


![[Ch 6] Set Theory 1. Basic Concepts and Definitions](/cache/preview/c/e/2/4/1/3/7/e/thumb-ce24137e0a382875a0c9905ad219dbfc.jpg)


![[Ch 3, 4] Logic and Proofs (2) 1. Valid and Invalid ...](/cache/preview/d/5/4/f/1/b/4/3/thumb-d54f1b43140ae25ae5daa306e1f8330e.jpg)