Transcription of Printing - Standard Methods for the Examination of Water ...
1 Standard Methods for the Examination of Water and Wastewater Copyright 1999 by American Public Health Association, American Water Works Association, Water Environment FederationPart 1000 INTRODUCTION1010 INTRODUCTION1010 A. Scope and Application of Methods The procedures described in these standards are intended for the Examination of waters of awide range of quality, including Water suitable for domestic or industrial supplies, surface Water ,ground Water , cooling or circulating Water , boiler Water , boiler feed Water , treated and untreatedmunicipal or industrial wastewater, and saline Water . The unity of the fields of Water supply,receiving Water quality, and wastewater treatment and disposal is recognized by presentingmethods of analysis for each constituent in a single section for all types of waters. An effort has been made to present Methods that apply generally.
2 Where alternative methodsare necessary for samples of different composition, the basis for selecting the most appropriatemethod is presented as clearly as possible. However, samples with extreme concentrations orotherwise unusual compositions or characteristics may present difficulties that preclude thedirect use of these Methods . Hence, some modification of a procedure may be necessary inspecific instances. Whenever a procedure is modified, the analyst should state plainly the natureof modification in the report of results. Certain procedures are intended for use with sludges and sediments. Here again, the efforthas been to present Methods of the widest possible application, but when chemical sludges orslurries or other samples of highly unusual composition are encountered, the Methods of thismanual may require modification or may be inappropriate. Most of the Methods included here have been endorsed by regulatory agencies.
3 Proceduralmodification without formal approval may be unacceptable to a regulatory body. The analysis of bulk chemicals received for Water treatment is not included herein. Acommittee of the American Water Works Association prepares and issues standards for watertreatment chemicals. Part 1000 contains information that is common to, or useful in, laboratories desiring toproduce analytical results of known quality, that is, of known accuracy and with knownuncertainty in that accuracy. To accomplish this, apply the quality assurance Methods describedherein to the Standard Methods described elsewhere in this publication. Other sections of Part1000 address laboratory equipment, laboratory safety, sampling procedures, and methoddevelopment and validation, all of which provide necessary information. Standard Methods for the Examination of Water and Wastewater Copyright 1999 by American Public Health Association, American Water Works Association, Water Environment Federation1010 B.
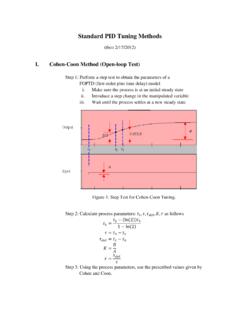
4 Statistics1. Normal Distribution If a measurement is repeated many times under essentially identical conditions, the resultsof each measurement, x, will be distributed randomly about a mean value (arithmetic average)because of uncontrollable or experimental error. If an infinite number of such measurementswere to be accumulated, the individual values would be distributed in a curve similar to thoseshown in Figure 1010:1. The left curve illustrates the Gaussian or normal distribution, which isdescribed precisely by the mean, , and the Standard deviation, . The mean, or average, of thedistribution is simply the sum of all values divided by the number of values so summed, , = ( ixi)/n. Because no measurements are repeated an infinite number of times, an estimate ofthe mean is made, using the same summation procedure but with n equal to a finite number ofrepeated measurements (10, or 20, or.)
5 This estimate of is denoted by x. The standarddeviation of the normal distribution is defined as = [ (x )2/n]1/2. Again, the analyst can onlyestimate the Standard deviation because the number of observations made is finite; the estimateof is denoted by s and is calculated as follows: The Standard deviation fixes the width, or spread, of the normal distribution, and also includes afixed fraction of the values making up the curve. For example, of the measurements liebetween 1 , between 2 , and between 3 . It is sufficiently accurateto state that 95% of the values are within 2 and 99% within 3 . When values are assignedto the multiples, they are confidence limits. For example, 10 4 indicates that theconfidence limits are 6 and 14, while values from 6 to 14 represent the confidence interval. Another useful statistic is the Standard error of the mean, , which is the Standard deviationdivided by the square root of the number of values, or.
6 This is an estimate of the accuracyof the mean and implies that another sample from the same population would have a mean withinsome multiple of this. Multiples of this statistic include the same fraction of the values as statedabove for . In practice, a relatively small number of average values is available, so theconfidence intervals of the mean are expressed as where t has the following values for95% confidence intervals: n t 3 Standard Methods for the Examination of Water and Wastewater Copyright 1999 by American Public Health Association, American Water Works Association, Water Environment Federation n t 4 5 10 The use of t compensates for the tendency of a small number of values to underestimateuncertainty. For n > 15, it is common to use t = 2 to estimate the 95% confidence interval. Still another statistic is the relative Standard deviation, / , with its estimate s/x, also knownas the coefficient of variation (CV), which commonly is expressed as a percentage.
7 This statisticnormalizes the Standard deviation and sometimes facilitates making direct comparisons amonganalyses that include a wide range of concentrations. For example, if analyses at lowconcentrations yield a result of 10 mg/L and at high concentrations 100 8 mg/L, thestandard deviations do not appear comparable. However, the percent relative Standard deviationsare 100 ( ) = 15% and 100 (8/100) = 8%, which indicate the smaller variability obtained byusing this parameter. 2. Log-Normal Distribution In many cases the results obtained from analysis of environmental samples will not benormally distributed, , a graph of the data will be obviously skewed, as shown at right inFigure 1010:1, with the mode, median, and mean being distinctly different. To obtain a nearlynormal distribution, convert the results to logarithms and then calculate x and s. Theantilogarithms of these two values are estimates of the geometric mean and the geometricstandard deviation, xg and sg.
8 3. Rejection of Data Quite often in a series of measurements, one or more of the results will differ greatly fromthe other values. Theoretically, no result should be rejected, because it may indicate either afaulty technique that casts doubt on all results or the presence of a true variant in the practice, reject the result of any analysis in which a known error has occurred. Inenvironmental studies, extremely high and low concentrations of contaminants may indicate theexistence of areas with problems or areas with no contamination, so they should not be rejectedarbitrarily. An objective test for outliers has been If a set of data is ordered from low to high:xL, x2 .. xH, and the average and Standard deviation are calculated, then suspected high or lowoutliers can be tested by the following procedure. First, calculate the statistic T : Standard Methods for the Examination of Water and Wastewater Copyright 1999 by American Public Health Association, American Water Works Association, Water Environment FederationSecond, compare the value of T with the value from Table 1010:I for either a 5% or 1% level ofsignificance.
9 If the calculated T is larger than the table value for the number of measurements, n,then the xH or xL is an outlier at that level of significance. Further information on statistical techniques is available ,3 4. References 1. BARNETT, V. & T. LEWIS. 1984. Outliers in Statistical Data. John Wiley & Sons, NewYork, 2. NATRELLA, 1963. Experimental Statistics. National Bur. standards Handbook 91,Washington, 3. SNEDECOR, & COCHRAN. 1980. Statistical Methods . Iowa State UniversityPress, C. Glossary1. Definition of Terms The purpose of this glossary is to define concepts, not regulatory terms; it is not intended tobe all-inclusive. Accuracy combination of bias and precision of an analytical procedure, which reflects thecloseness of a measured value to a true value. Bias consistent deviation of measured values from the true value, caused by systematic errorsin a procedure.
10 Calibration check Standard Standard used to determine the state of calibration of an instrumentbetween periodic recalibrations. Confidence coefficient the probability, %, that a measurement result will lie within theconfidence interval or between the confidence limits. Confidence interval set of possible values within which the true value will lie with a specifiedlevel of probability. Confidence limit one of the boundary values defining the confidence interval. Detection levels Various levels in increasing order are: Instrumental detection level (IDL) the constituent concentration that produces a signalgreater than five times the signal/ noise ratio of the instrument. This is similar, in manyrespects, to critical level and criterion of detection. The latter level is stated asStandard Methods for the Examination of Water and Wastewater Copyright 1999 by American Public Health Association, American Water Works Association, Water Environment times the s of blank analyses.