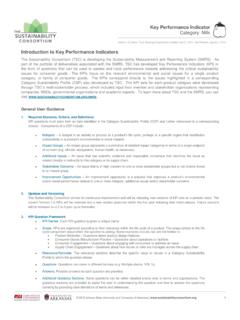
Transcription of Process Optimization of Wastewater Treatment …
1 Process Optimization of Wastewater Treatment plants David Hackworth, September 25, 2013 Many Resources Are Available to Assist You Water Environment Research Foundation USEPA Energy Management Guidebook Overview WERF CHEApet Optimization Challenge Energy Management Solids Volume Reduction Resource Recovery Process Optimization The Optimization GoalTo develop and demonstrate economical and environmentally responsible processes that improve Wastewater and solids Treatment operations efficiencies and costs by at least 20%: 20% less energy 20% more resource recovery 20% less solids producedThese goals can be achieved at most Resources Are Available to Assist You Water Environment Research Foundation USEPA Energy Management Guidebook Benefits of Process Optimization Reduce Environmental Impact Every worthwhile opportunity comes with risks Reduce Operating Costs Improve Water Quality/ performance Operator Satisfaction Customer Satisfaction Risks associated with Process Changes Increased costs Our goal is to find the appropriate balance of reward/risk.
2 Operator Stress Permit Violations Customer Complaints Step 1- Charter the team (Define project goals and responsibilities) Financial Objectives (operational, capital, ROI) Risk Tolerance Risk Mitigation Communication Plan Step 2 Collect Data Power Demand Use Power Factor Submetering Chemicals Coagulants Polymers (coagulant aid and dewatering) Odor Control Process Data Influent/Effluent/ Process concentrations Treatment removal efficiencies Sludge yields Mass Balances Recycle streams Step 3 Develop Models and key performance indicators Develop Models Spreadsheet Tools Plant Hydraulics Process (Biowin, CHEAPET) $243$245$246$248$249$251$252$254$255$257 $258$260$261$263$264$266$267$269$270$272 $273 Cost/TonYearly CostCost/TonYearly $241$242$244$245$247$248$250$251$253$254 $256$257$259$260$262$263$265$266$268$269 $271$ $1,260, $ $1,476, $238$240$241$243$244$246$247$249$250$252 $253$255$256$258$259$261$262$264$265$267 $268$ $1,271, $ $1,487, $236$237$239$240$242$243$245$246$248$249 $251$252$254$255$257$258$260$261$263$264 $266$ $1,281, $ $1,498, $233$235$236$238$239$241$242$244$245$247 $248$250$251$253$254$256$257$259$260$262 $263$ $1,292, $ $1,509, $231$233$234$236$237$239$240$242$243$245 $246$248$249$251$252$254$255$257$258$260 $261$ $1,303, $ $1,519, $229$231$232$234$235$237$238$239$241$242 $244$245$247$248$250$251$253$254$256$257 $259$ $1,314, $ $1,530.
3 $227$228$230$231$233$234$236$237$239$240 $242$243$245$246$248$249$251$252$254$255 $257$ $1,325, $ $1,541, $225$226$228$229$231$232$234$235$237$238 $240$241$243$244$246$247$249$250$252$253 $255$ $1,336, $ $1,552, $223$224$226$227$229$230$232$233$235$236 $238$239$241$242$244$245$247$248$250$251 $253$ $1,346, $ $1,563, $221$222$224$225$227$228$230$231$233$234 $236$237$239$240$242$243$245$246$248$249 $251$ $1,357, $ $1,573, $219$220$222$223$225$226$228$229$231$232 $234$235$237$238$240$241$243$244$246$247 $249$ $1,368, $ $1,584, $217$218$220$221$223$224$226$227$229$230 $232$233$235$236$238$239$241$242$244$245 $247$ $1,379, $ $1,595, $215$217$218$220$221$223$224$226$227$229 $230$232$233$235$236$238$239$241$242$243 $245$ $1,390, $ $1,606, $213$215$216$218$219$221$222$224$225$227 $228$230$231$233$234$236$237$239$240$242 $243$ $1,400, $ $1,617, $212$213$215$216$218$219$220$222$223$225 $226$228$229$231$232$234$235$237$238$240 $241$ $1,411, $ $1,627, $210$211$213$214$216$217$219$220$222$223 $225$226$228$229$231$232$234$235$237$238 $240$ $1,422, $ $1,638, $208$210$211$213$214$216$217$219$220$222 $223$225$226$228$229$231$232$234$235$237 $238$ $1,433, $ $1,649, $206$208$209$211$212$214$215$217$218$220 $221$223$224$226$227$229$230$232$233$235 $236$ $1,444, $ $1,660, $205$206$208$209$211$212$214$215$217$218 $220$221$223$224$226$227$229$230$232$233 $235$ $1,454, $ $1,671, $203$205$206$208$209$211$212$214$215$217 $218$220$221$223$224$226$227$229$230$232 $233$ $1,465, $ $1,681.
4 $33$ Centrifuge Operating Cost ToolDesired RangeAdequate RangeCentrifuge Cake SolidsPolymer DoseNote: Centrifuge Cake Solids Units - % TSPolymer Dosage Units - Lbs/Dry Ton To use the tool manipulate the 3 variables (S30-S32) to reflect actual values. Undesirable RangeYearly Costs Multiplied by Dry TonsYearly Costs Multiplied by Dry TonsDisposal Cost/Ton Polymer Cost/Lb39 Dry Tons/YearProcess Model Example Energy Chemicals Solids Handling Process Develop Holistic Approach Review current operation and maintenance practices NOT JUST ELECTRICAL Baseline information on all aspects of the facilities from: Process data and permit limits Electrical usage and rate structures Chemical usage and cost Assets HVAC systems Storage capacities Solids handling Natural gas or Bio gas usage Step 3 (cont) - key performance indicators KPI Summary Sheet WWTP Table 1 Basis Line Values WWTP Parameter Base Line Value Discription Flow ML/Year Base Q Annual Flow ML/Year 8433 Base Q PO4 6 month cBOD (mg/l) Base Line cBOD TSS (mg/l) Base Line TSS PO4 (mg/l) Base Line PO4 WWTP Power kWh/ML Base Line Flow Power KPI kWh/ kg cBod Base line cBOD Power KPI kWh/ kg TSS Base Line TSS Power KPI Ratio kg TSS/kg cBOD Base Line Ratio cBOD/TSS kg cBOD (annual) 4,444,296 Base Line kg cBOD kg TSS (Annual)
5 6,616,277 Base Line kg TSS kg PO4 (6 Summer months) 62,330 Base Line kg PO4 Alum usage kg/ML Base Line Alum Flow usage KPI Alum usage kg/ mg/l PO4 Base Line Alum load usage KPI Wet Tonnes of Solids / Ton cBOD Base lne Tonnes of Solids/Ton cBOD KPI Wet Tonnes of Solids / Ton TSS Base lne Tonnes of Solids/ Ton TSS KPI kg Dewatering-Polymer/kg cBOD Base line kg D-Polymer / kg cBOD KPI kg Thickening-Polymer/kg cBOD Base line kg T-Polymer / kg cBOD KPI kg Dewatering-Polymer/kg TSS Base line kg D-Polymer / kg TSS KPI kg Thickening-Polymer/kg TSS Base line kg T-Polymer / kg TSS KPI Step 4 Indentify Opportunities
6 And Prepare Business Case Evaluations Opportunities Operational change Minor Capital Improvement Major Capital Improvement Business Case Evaluation Capital Costs Operational and Maintenance Costs Risks Non Economic Benefits LCAMER Tool Capabilities Evaluates alternatives and associated benefits and costs in planning and early design stages Evaluates what-if scenarios including Sensitivity Analyses Estimates GHG emissions and carbon foot print evaluation Facilitates discussions with regulatory agencies and project stake holders Example WERF Tool to assist in BCE MS Excel Based Tool with Built-In Worksheets Regional temperature and emission factors Volatile solids reduction model Parametric costs Process and cost analysis functions Internal combustion engines (ICE) Gas turbines Microturbines Stirling Engines Fuel cellsStep 5 Prioritize and Develop Implementation Plan Priorities Priority 1 Recommended to achieve majority of energy savings Priority 2 Would provide additional energy savings but have a longer pay back period Priority 3 Would provide for fine tuning of Process and some additional power savings Implementation Plan Category I Immediate Category II Short Term 1-3 years or Category III Long Term 3-5 years Opportunities for Energy Efficiency High Energy Using Operations Energy Savings Measures Pumping Reduce load Manage load Water to wire efficiency Pump selection Automated control Aeration Fine bubble Improved surface aerators Premium motors High efficiency motor drive Blower Control Automatic DO control High Energy Using
7 Operations Energy Savings Measures Lighting Motion sensors T5 low and high bay fixtures Pulse start metal halide Indirect fluorescent Comprehensive control for large buildings Heating, Ventilation, Air Conditioning (HVAC) Water source heat pumps Custom incentives for larger units Low volume fume hoods Occupancy controls Heat pump for generator oil sump Understand Your Power Bill Meet with your local power provider to understand your rate structure and develop strategies to reduce costs Power Bill Components: Demand Ratchet Demand Use Power Factor Fuel Time of Use Energy Savings Operational Changes Demand Management Shed equipment during peak energy use. Energy Reduction Monitor DO in aeration basins and maintain at 2 mg/l or less Time of Use Consider shifting activities during night shift Develop benchmarks and closely monitor Energy Savings Minor Capital Improvements Demand Management Automation routines to shed non vital equipment Energy Reduction Automated DO control for aeration basins Power Factor Install capacitor banks to increase PF Energy Savings Major Capital Replacements Replace Aeration Diffusers Replace Blowers Replace Pumps Replace Motors Install Cogeneration System System Wide (real time)
8 Energy Optimization Systems Energy Savings - Plant Compressed Air Systems 21 Baseline Compress and dry air used for Pneumatic Primary Sludge Pumps and other controls Maintenance issues with compressor cooling system Required 500,000 gpd of potable (softened water) New close loop heat exchanger with air cooled or reclaim water Recommended Action Plan Re-size new air compressor (25% of original) which allows air cooled unit Savings/Benefits: 50% overall power costs, no softened water required, minimal maintenance Allows resizing and possible elimination of air gap tank and associated pumps Energy Savings (cont) System Wide (real time) Energy Optimization Systems Resulting from groundbreaking advances in combined use of genetic algorithms and artificial neural networks, ENCOMS identifies in realtime the optimal operational control settings that will best meet not only the current demands but also the projected ones along the operating horizon (typically 24 hours) at maximum cost savings, taking account of the electricity rate structure, system operational constraints, and demand projections.
9 The real-time control Process operates continually and is updated at periodic intervals by SCADA data and new demand forecasts. ENCOM: Energy Cost Minimization System Case Studies - 20% saving Evaluate multiple factors to evaluate projects Solids Handling Operational Changes Dewatering polymer Optimization Continuously evaluate best deal for disposal Process Changes (SRT/Digestion) Develop benchmarks and closely monitor Solids Handling Capital Improvements Replace Solids Process Technology Replace Dewatering Equipment WERF LCAMER (Life Cycle Assessment Manager for Energy Recovery) tool LCAMER OUTPUT Chemical Savings - Operational Develop benchmarks and closely monitor Frequent calibration checks Tune Control Loops Chemical Savings - Capital New Disinfection System ( UV, onsite hypo generation) Improved Chemical Mixing ( water champs or statiflo) Chemical Feed Modifications New Odor Control (ie.)
10 Biofilters) Process Changes Consider Holistic Effects of Any Process Changes Variables: Units in service Processes In Service MCRT/SRT Solids Processing Objectives Example NSU - Configuration Available Current Alt. No. 4 Aeration Basins Aerobic Digesters 4 4 4 NSU - Process Current Alt. No. 4 Range Typical Cake Solids, % - 15-23 18 Polymer Use, lbs/ton - 8-20 10 Run Time, hrs/d - NSU - performance Actual Current Alt. No. 4 Range Typical SRT, days = 10-30 15 HDT wo/RAS, hrs. = 8-36 12 Clarifier Slds Loading, Lbs/D/SF = 5-24 12 Belt Press Hydraulic Loading, gpd/U = 98848 112892 57k-115K Belt Press Solids Loading, lbs/d/U = 7672 9483 Solids Produced lbs/day Solids Produced cy/day = NSU - Costs Actual Alt. No. 4 Savings CHEMICALS $ 15,431 $ 22,009 $ (6,578) CONTRACT HAULING COSTS $ 161,280 $ 228,750 $ (67,470) ELECTRICITY $ 401,047 $ 323,261 $ 77,786 Total $ 577,758 $ 574,020 $