Transcription of Production and Cost Analysis - StFX
1 Production and Cost Analysis The entire Production process begins with the supply of factors of Production or inputs used towards the Production of a final good we all consume in the final good market. Some examples of these factors of Production are the labor you will supply when you graduate, machines, raw materials such as pulp, power ( such as gas, electricity), machines, factory complex, research laboratory etc. We will begin by assuming that the prices of factors of Production are constant first. The reason for this initial simplification is that we want to understand first how and why firms choose a particular way of producing given those prices. Objectives: 1. Differentiate between economic and accounting profit.
2 2. Distinguish between long and short run Production . 3. Understand what is diminishing marginal productivity. 4. How to calculate the various cost measures, and concepts. 5. Distinguish between various cost curves, and describe their interrelationship, and individual shapes. 6. Understand the firm s choice using the cost curves. The role of the firm The firm as an economic institution (or a component in the market economy machine) transforms or converts factors of Production into goods and services. Precisely, Organizes factors of Production Produces the goods/services Sells to and/or businesses/firms and/or government. The precise combination of activities and process is dependent on the cost of each process. If subcontracting out a process without any loss of quality is attainable, it would be sensible to do so.
3 While for another, where quality and precision might be loss if a particular process is subcontracted out, the firm under consideration would not do so. Let us consider two examples. 1. Consider why most North American Ready-to-Wear clothing firms subcontract the clothing manufacturing process to China. The most common reason is often efficiency and cost gains in the process. Do you think there is any other reason for them to do so? 2. Most of your mountain bikes are manufactured by one of a few firms in Taiwan, the largest being Gaint. Why do you think Cervelo is still manufactured out of Quebec, and why is Rocky Mountain bicycles are manufactured in British Columbia? Cervelo for example has proprietory rights over their aluminum tube construction, which may make subcontracting costly strategically, or if the suppliers of those tubes are based out of North America.
4 From the examples, and our earlier examination of demand and supply, we can make the following notes: How an economy operates, which activities are undertaken through the market or the firm through trading 1. depends on transaction costs, and 2. the rent or command over resources. Consider another simple real life example: From it s inception, Timbuk2 bags were manufactured out of San Francisco, and the marketing pitch was that it was homegrown, and home built. Visit their website, and see how many of their line of bags are manufactured within San Francisco, and which are subcontracted out to Chinese manufacturing. How do we model a Firm s choice? 1. Firms Maximize Profits When you choose to purchase a particular good, you intrinsically choose the object that gives you the greatest enjoyment or joy.
5 We translate the same concept into firms choice, but unlike your enjoyment, which is difficult to measure, the conceptualization of the firms choice is a little easier. We simply monetize the gains in terms of profits, after netting off wages, and rents. It is a simple idea, the greater the total revenue, the greater the share that can be paid out, and the more that can be reinvested to further develop the product line, and increase market share. Of course not every firm can be described by this idea, for example a non-profit hospital. However, what we will be describing will describe the majority of the firms we see. In terms of an equation, a firm maximizes then the following, Profit = Total Revenue Total Cost Conceptually, total revenue equals total sales multiply by price.
6 While total cost is the sum of wage rate, rental rates etc multiply by the number of units and time put into used. However, we must note the following finer points, 1. However in accounting, accountants focus on explicit revenues and costs, or quantifiable revenues and cost that enter into the books . In terms of revenue, there is no difference. However, the difference arises when we think of costs. Accountants focus on quantifiable cost, amounts they receive printed on their receipts. 2. An economist on the other hand include implicit costs, that is, Total Cost = Implicit Cost + Explicit Cost Implicit Cost includes the opportunity cost of the factors of Production . 2. The Production Process Recall that when we consider supply curve that the long run supply is more elastic than the short run supply curve.
7 The rationale we had was that in the short run, certain factors of Production or inputs into a process are not variable. Hence the supply is inelastic, or quantities supplied is unresponsive to changes in own price changes. Note again, when we say short and long run, it does not necessarily mean a particular duration or number of years. It just differentiates between when some factors of Production are not variable (Short Run), and when it is all variable (Long Run). a. Production Tables and Production Functions Production tables and functions are an easy for us to conceptualize how firms choose their optimal combinations of inputs. Our description here does not describe the whole process, but a simplification. You have to be mindful of this.
8 This is done in detail in subjects such as Operations Research. The first two columns of the following table tells you something important. It tells you how much input, in this case, the number of workers, need to be hired to produce a certain amount of product. In other words, it tells you the relationship between the inputs (factor of Production ) and output. Of course a real firm needs more factors of Production that just labor. What other information can be gleamed from the table. First note that at any time, a firm has some variables to meet immediate changes in demand, but others it can not. Examples of the former are labor and materials, while examples of the latter are factory floor space, number of machines used in a manufacturing process.
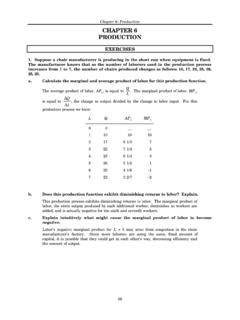
9 There is a very interesting notion that can be introduced here, and that is the concept of marginal product, which means the additional output that will result from an additional input (say labor), holding the level of other inputs constant. Note that this concept is different from average product, which means the output per worker. A variation of figure 9-1 on page 203 of your text shows you how marginal and average product is calculated and graphed. What can you say about the changes in the marginal and average product of labor? Number of Workers (L) Total Output Calculation for MPL Marginal Product (MPL) Calculation for APL Average Product (APL) 1 8 8-0 8 8/1 8 2 20 20-8 12 20/2 10 3 34 34-20 14 34/3 4 46 46-34 12 46/4 5 56 56-46 10 56/5 6 62 62-56 6 62/6
10 7 64 64-62 2 64/7 8 64 64-64 0 64/8 8 9 60 60-64 -4 60/9 10 50 50-60 -10 50/10 5 Putting the numbers on a diagram may help you see the relationship. Total Output Decreasing Marginal Productivity 60 Increasing Marginal Productivity 40 Increasing Marginal Productivity 20 Number of Workers Average Product of Labor Marginal Product of Labor Number of Workers The main idea is the following: 1.