Transcription of PROJECT COMPLETION PROBABILITY AFTER …
1 59 PROJECT COMPLETION PROBABILITY AFTER crashing PERT/CPM NETWORK M Nazrul, ISLAM1, Eugen, DRAGHICI2 and M Sharif, UDDIN3 1 Jahangirnagar University, Bangladesh, 2 Lucian Blaga University of Sibiu, Romania, 3 Jahangirnagar University, Bangladesh, ABSTRACT: This paper analyzed a mathematical model for estimating the PROJECT COMPLETION PROBABILITY AFTER crashing PERT/CPM network. Here we reduced the pessimistic time of the activities on critical path to reduce the expected PROJECT COMPLETION time which increase the PROBABILITY of the PROJECT COMPLETION on or before the scheduled time.
2 Some additional cost is required for the activities along critical path to speed-up the PROJECT . The increment of the estimate cost decreases the pessimistic time of the activities along critical path and indirectly decreases the total expected PROJECT duration. The approach has been modelled in mathematical and algorithmic aspects and finally presented with a numerical example. 1. INTRODUCTION CPM/PERT or Network Analysis as the technique is sometimes called, developed along two parallel streams, one industrial and the other military.
3 CPM was the discovery of M. R. Walker of E. I. Du Pont de Nemours & Co. and J. E. Kelly of Remington Rand, circa 1957. The computation was designed for the UNIVAC-I computer. The first test was made in 1958, when CPM was applied to the construction of a new chemical plant. In March 1959, the method was applied to maintenance shut-down at the Du Pont works in Louisville, Kentucky. Unproductive time was reduced from 125 to 93 hours. PERT was devised in 1958 for the POLARIS missile program by the Program Evaluation Branch of the Special Projects office of the U.
4 S. Navy, helped by the Lockheed Missile Systems division and the Consultant firm of Booz-Allen & Hamilton. The calculations were so arranged so that they could be carried out on the IBM Naval Ordinance Research Computer (NORC) at Dahlgren, Virginia. PROJECT crashing is a method for shortening the PROJECT duration by reducing the time of one or more of the critical PROJECT activities to less than its normal activity time. The object crashing is to reduce PROJECT duration while minimizing the cost of crashing .
5 Fulkerson (1961) and Premachandra (1992) reformulate the problem of crashing PERT network as a linear program, reducing the time required to find the optimal solution. Moore et al. (1978) reformulate the problem using goal programming. Goal programming is a modification of linear programming that can solve problems with multiple objectives. This allows goals in addition to cost minimization to be added to the problem. Foldes and Sourmis (1993) present a reformulation of crashing networks when the cost-time tradeoff is represented by non-linear, non-differentiable convex function.
6 T Wei Peng at al (2010) analyzed numerical results of crashing CPM/PERT network to the increase of the PROBABILITY or percentage of completing the PROJECT on or before the COMPLETION time by reducing pessimistic time of critical activities. crashing PERT networks was investigated by a number of researchers, such as Cho and Yum (1997), Ghaleb and Adnan (2001), Johnson and Schou (1990), Keefer and Verdini (1993), Saman (1991). There exist and example in Nicholas & Steyn (2008). that the PROBABILITY that PROJECT will be finished before the expected duration are 1%-50%, while PROBABILITY that PROJECT will be finished AFTER the expected duration are 50%-99%.
7 The concept of crashing in CPM is applied to PERT networks in order to reduce the PROJECT duration of the PROJECT , and also to increase the PROBABILITY of completing the PROJECT on or before COMPLETION time with the additional amounts of money that will be invested to activities on the critical path. 2. PERT FOR PROJECT COMPLETION PROBABILITY PERT is a management technique to estimate the PROBABILITY that a PROJECT will be finished on normal time. According to the traditional PERT technique the PROBABILITY of a certain PROJECT meeting a specific schedule time can be described as follows: = = Here, is the number of standard deviations of the due date or target date lies from the mean or expected date.
8 Is the normal expected time which is equal to the sum of normal expected times of activities on critical path. That means if , !, .. , # are the expected times of critical path activities, then = $ % , = 1, 2, .. , (.#% * is the due date or targeted date of COMPLETION and is the PROJECT standard deviation which is written as =+ =,$ =.$ %#%* % and % for each activity are measured by the following formulae %=/012034 and %= 536/47! 60 The time estimates , , 8 are defined as follows: Optimistic time (a): the minimum possible time required to accomplish a task, assuming everything proceeds better than is normally expected Most likely time (m): the best estimate of the time required to accomplish a task, assuming everything proceeds as normal Pessimistic time (b): the maximum possible time required to accomplish a task, assuming everything goes wrong.)
9 3. PROJECT COMPLETION PROBABILITY TO MEET THE DESIRED DURATION Concept of PROJECT crashing requires the investment of extra budget to minimize the duration so that the PROJECT can meet the targeted date. The delay of the activities on critical path makes the delay of the whole PROJECT . So, if we can finish the critical path activities before their normal estimated times, the PROJECT will be finished on or before the targeted time. For this, the extra budget will be invested for the activities along the critical path.
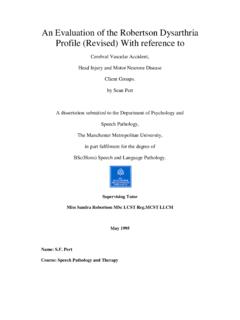
10 The increasing of budget in critical path activities will minimize the total PROJECT duration and will increase the PROBABILITY of the PROJECT COMPLETION on or before the targeted date. Activity time-cost relationship: Activity cost Crash cost Normal cost Crash time Normal time Activity duration Figure 1. Linear time and cost trade-off for an activity 4. MATHEMATICAL ASPECT Suppose that the amount of money invested in each critical path activity is % where = 1, 2.