Transcription of Project Management - Gantt Chart Tutorial
1 Gantt Chart 9/17/2004 page 1 Project Management - Gantt Chart Tutorial Adapted from W. Durfee and T. Chase, 2003, University of Minnesota The assignment Your team is expected to produce a Gantt Chart and to keep it up to date for use in managing your Project . Gantt charts are an effective planning tool for organizing your effort and intelligently allocating resources and personnel. Use MS Project (available in ME computer studio) to produce your Chart . Why MS Project ? Because it is the most widely used Project planning package in industry and you should be learning how to use "real world" tools. Follow these guidelines in creating your Chart : Use weeks as the time unit Include the Proposal, Detailed Design Specification, Project Showcase, and Final Report as milestones.
2 Have up to four additional milestones, no more. Show more detail on design tasks, less detail on reports/documentation/presentation tasks. You should have about 3/4 design tasks, 1/4 documentation/presentation related tasks. Ordering and getting parts can take 2 weeks or more, depending on the part. If your sponsor is building parts for your prototype, getting your part scheduled can take a long time. Build these delays into your planning Chart . Review and update Gantt Chart every 14 days, more often if needed. Designate one person in your team to maintain and update your Gantt Chart For our purposes, you should be able to fit your entire Gantt Chart on one 8 x 11 sheet Build in at least one week of contingency at the end of the semester.
3 Project planning basics A Project is a set of activities which ends with specific accomplishment and which has (1) Non-routine tasks, (2) Distinct start/finish dates, and (3) Resource constraints (time/money/people/equipment). Tasks are activities that must be completed to achieve the Project goal. Break the Project into small tasks and subtasks. Tasks have start and end points, are short relative to the Project and are significant (not "going to library", but rather, "search literature"). Shorter tasks are easier to track and manage than long tasks. For our 14 week Project , no individual task should be longer than one week. Use verb-noun form for naming tasks, "create drawings" or "build prototype".
4 Use action verbs such as "create", "define" and "gather" rather than "will be made". Each task has a time duration. It can be very difficult to estimate durations accurately. Doubling your best guess usually works well. Allow some contingency time for unexpected events (10-25%). Milestones are important checkpoints or interim goals for a Project . They can be used to catch scheduling problems early. Name by noun-verb form, "report due", "parts ordered", "prototype complete". Your plan will evolve so be flexible and update on a regular basis. It also helps to identify risk areas for Project , for example, things you don't know how to do but will have to learn.
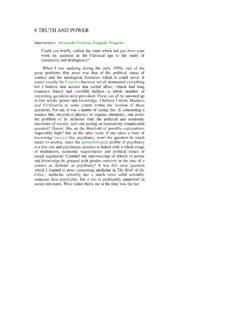
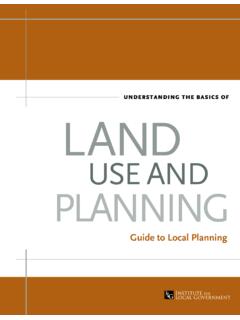
5 These are risky because you may not have a good sense for how long the task will take. Or, you may not know how long it will take to receive components you purchased for a Project . Gantt Chart 9/17/2004 page 2 Work Breakdown Statement A good place to begin a Gantt Chart is from a work breakdown statement (WBS) - a categorized list of tasks with an estimate of resources required to complete the task. An example WBS appears below. WBS # Task Description Est Person-Hrs Who Resources M&S 5 Profile motor power Design test stand 20 SE, JM Pro/E Build test stand 15 SE, JM Frame & brake parts $35 Test 3 motors 3 SE, JM Stroboscope $75 Plot torque vs.
6 Speed 2 JM Excel (M&S = Materials & Supplies) Gantt Chart basics A Gantt Chart is a Project planning tool that can be used to represent the timing of tasks required to complete a Project . Because Gantt charts are simple to understand and easy to construct, they are used by most Project managers for all but the most complex projects. In a Gantt Chart , each task takes up one row. Dates run along the top in increments of days, weeks or months, depending on the total length of the Project . The expected time for each task is represented by a horizontal bar whose left end marks the expected beginning of the task and whose right end marks the expected completion date.
7 Tasks may run sequentially, in parallel or overlapping. As the Project progresses, the Chart is updated by filling in the bars to a length proportional to the fraction of work that has been accomplished on the task. This way, one can get a quick reading of Project progress by drawing a vertical line through the Chart at the current date. Completed tasks lie to the left of the line and are completely filled in. Current tasks cross the line and are behind schedule if their filled-in section is to the left of the line and ahead of schedule if the filled-in section stops to the right of the line. Future tasks lie completely to the right of the line. In constructing a Gantt Chart , keep the tasks to a manageable number (no more than 15 or 20) so that the Chart fits on a single page.
8 More complex projects may require subordinate charts which detail the timing of all the subtasks that make up one of the main tasks. For team projects, it often helps to have an additional column containing numbers or initials which identify who on the team is responsible for the task. Group the tasks under major headings that correspond to the steps in the design process, such as: Problem Definition, Project planning , Gathering Information, Conceptual Design, Concept Selection, Detail Design, Implementation, Testing, Documentation, etc. Often the Project has important events that you would like to appear on the Project timeline, but which are not tasks. For example, you may wish to highlight when a prototype is complete or the date of a design review.
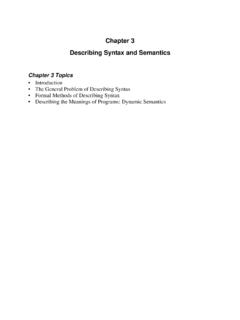
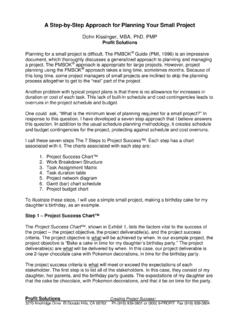
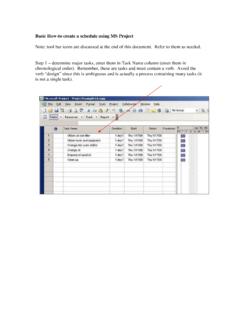
9 You enter these on a Gantt Chart as "milestone" events and mark them with a special symbol, often an upside-down triangle. Gantt Chart 9/17/2004 page 3 Using Excel to Make Gantt Charts A sample Gantt Chart made using Microsoft Excel appears in the figure below. If today's date were May 13, Task A would be behind schedule, Task B ahead and Task C right on schedule. The events marked by fat dots are milestones. Gantt charts made with Excel are easy to update and maintain. Here's how to do it. On a piece of scrap paper or a chalk board, make a list of tasks and assign each task tentative start and stop dates (or durations) and the people responsible for the task.
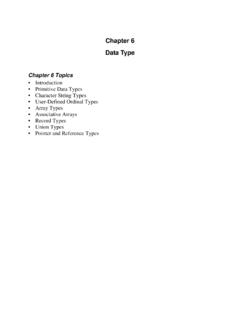
10 Also list important milestones and their dates. If you have more than 15 or 20 tasks, split your Project into main tasks and subtasks, then make an overall Gantt Chart for the main tasks and separate Gantt charts for the subtasks which make up each main task. Decide what resolution to use in the timeline. For projects of three months or less, use days, for longer projects use weeks or months, and for very short Project use hours. For these instructions, we will assume you have chosen a resolution of days. Gantt Chart 9/17/2004 page 4 Fire up Excel. Under Page Setup, select landscape orientation, and then select the options to center the Chart horizontally and vertically on the page.