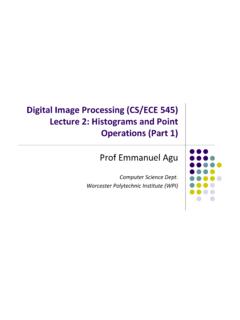
Transcription of Radar Systems Engineering Lecture 6 Detection of Signals ...
1 IEEE New Hampshire SectionRadar Systems Course 1 Detection 1/1/2010 IEEE AES SocietyRadar Systems Engineering Lecture 6 Detection of Signals in NoiseDr. Robert M. O DonnellIEEE New Hampshire SectionGuest Lecturer Radar Systems Course 2 Detection 11/1/2010 IEEE New Hampshire SectionIEEE AES SocietyBlock Diagram of Radar SystemTransmitterWaveformGenerationPower AmplifierT / RSwitchAntennaPropagationMediumTargetRad arCrossSectionPhoto ImageCourtesy of US Air ForceUsed with Rejection(Doppler Filtering)A / DConverterGeneral Purpose ComputerTrackingDataRecordingParameterEs timation DetectionSignal Processor ComputerThresholdingUser Displays and Radar ControlThis LectureRadar Systems Course 3 Detection 11/1/2010 IEEE New Hampshire SectionIEEE AES SocietyOutline Basic concepts Probabilities of Detection and false alarm Signal-to-noise ratio Integration of pulses Fluctuating targets Constant false alarm rate (CFAR)
2 thresholding SummaryRadar Systems Course 4 Detection 11/1/2010 IEEE New Hampshire SectionIEEE AES SocietyRadar Detection The Big Picture Mission Detect and track all aircraft within 60 nmi of Radar S-band ~ 10 cmExample Typical Aircraft Surveillance RadarASR-9 Courtesy of MIT Lincoln LaboratoryUsed with permissionRotationRate12. rpmRange60 at~ 1250 HzRadar Systems Course 5 Detection 11/1/2010 IEEE New Hampshire SectionIEEE AES SocietyRange-Azimuth-Doppler Cells to Be rpm10 Pulses / Half BWProcessed into10 Doppler FiltersExample Typical Aircraft Surveillance RadarASR-9 Range - Azimuth - Doppler Cells~1000 Range cells~500 Azimuth cells~8-10 Doppler cells5,000,000 Range-Az-Doppler Cellsto be threshold every Velocity (kts)Magnitude (dB)Doppler Filter BankAz Beamwidth~ As Antenna Rotates~22 pulses / BeamwidthIs There a Target Present in Each Cell?
3 RangeResolution1/16 nmiRadarTransmitsPulses at~ 1250 HzRange60 Systems Course 6 Detection 11/1/2010 IEEE New Hampshire SectionIEEE AES SocietyTarget Detection in Noise Received background noise fluctuates randomly up and down The target echo also Both are random variables! To decide if a target is present, at a given range, we need to set a threshold (constant or variable) Detection performance (Probability of Detection ) depends of the strength of the target relative to that of the noise and the threshold setting Signal-To Noise Ratio and Probability of False AlarmReceived Backscatter Power (dB)20403010 NoiseThresholdFalseAlarmDetectedStrongTa rgetWeak target (not detected)00 25 50 100 125 150 175 Range (nmi.) Radar Systems Course 7 Detection 11/1/2010 IEEE New Hampshire SectionIEEE AES SocietyThe Radar Detection ProblemRadarReceiverDetectionProcessingM easurementDecisionx10 HHornx=MeasurementProbabilityDensityTarg et absent hypothesis, Noise onlyTarget present hypothesis, Signal plus noisenax+=)Hx(p01H)Hx(p1 For each measurement There are two possibilities:For each measurement There are four decisions:0H0H1H1 HDon t ReportFalseAlarmDetectionMissedDetection TruthDecision0 HRadar Systems Course 8 Detection 11/1/2010 IEEE New Hampshire SectionIEEE AES SocietyMaximize subject to no greater than specified FAPDP() FAPT hreshold Test is Optimum0H0H1H1 HDon t ReportFalseAlarmDetectionMissedDetection TruthDecisionProbability of Detection :Probability of False Alarm.
4 DPFAPThe probability we choose when is trueThe probability we choose when is true1H1H1H0 HLikelihood Ratio Test > =)Hx(p)Hx(p)x(L01<1H0 HLikelihoodRatioThresholdObjective:Neyma n-PearsoncriterionRadar Systems Course 9 Detection 11/1/2010 IEEE New Hampshire SectionIEEE AES SocietyBasic Target Detection DensityDetection ThresholdNoise Probability DensityNoise OnlyTarget AbsentProbability of False Alarm ( PFA ) PFA = Prob{ threshold exceeded given target absent } the chance that noise is called a (false) target We want PFA to be very, very low!Probability of False Alarm ( PFA ) PFA = Prob{ threshold exceeded given target absent } the chance that noise is called a (false) targetWe want PFA to be very, very low!Courtesy of MIT Lincoln LaboratoryUsed with permissionRadar Systems Course 10 Detection 11/1/2010 IEEE New Hampshire SectionIEEE AES SocietyBasic Target Detection DensityDetection ThresholdNoise Probability DensitySignal-Plus-Noise Probability DensityProbability of False Alarm ( PFA ) Probability of False Alarm ( PFA )Signal + NoiseTarget PresentProbability of Detection ( PD ) PD = Prob{ threshold exceeded given target present } the chance that target is correctly detected We want PD to be near 1 (perfect)!
5 Probability of Detection ( PD ) PD = Prob{ threshold exceeded given target present } the chance that target is correctly detectedWe want PD to be near 1 (perfect)!)Hx(p1 Courtesy of MIT Lincoln LaboratoryUsed with permissionRadar Systems Course 11 Detection 11/1/2010 IEEE New Hampshire SectionIEEE AES SocietySignal Plus NoiseSNR = 10 dBPD = Plus NoiseSNR = 20 dBPD ~ 1 Detection Examples with Different SNR PD increases with target SNR for a fixed threshold (PFA ) Raising threshold reduces false alarm rate and increases SNR required for a specified Probability of Detection PD increases with target SNR for a fixed threshold (PFA ) Raising threshold reduces false alarm rate and increases SNR required for a specified Probability of DensityNoise OnlyDetection ThresholdPFA = of MIT Lincoln LaboratoryUsed with permissionRadar Systems Course 12 Detection 11/1/2010 IEEE New Hampshire SectionIEEE AES SocietyNon-Fluctuating Target pdfSignal-Plus-Noise pdfSet threshold rT based on desired false-alarm probabilityCompute Detection probability forgiven SNR and false-alarm probabilityIs Marcum s Q-Function(and I0 (x) is a modified Bessel function)whereRayleighRician() =2rexprHrp2o()()RrI2 RrexprHrpo21 + =2 RSNR=FAeTPlog2r =()()()FAer1 DPlog2,SNR2 QdrHrpPT == ()()
6 DrraI2arexprb,aQob22 + =Courtesy of MIT Lincoln LaboratoryUsed with permissionRadar Systems Course 13 Detection 11/1/2010 IEEE New Hampshire SectionIEEE AES SocietyProbability of Detection vs. SNRP robability of Detection (PD)Signal-to-Noise Ratio (dB)PFA =10-4 PFA =10-6 PFA =10-10 PFA =10-12 PFA =10-84 6 8 10 12 14 16 = dB needed for PD = and PFA = 10-6 Steady TargetRemember This! Radar Systems Course 14 Detection 11/1/2010 IEEE New Hampshire SectionIEEE AES SocietyProbability of Detection vs. SNRSNR = dB needed for PD = and PFA = 10-6 Steady TargetRemember This!Probability of Detection (PD)Signal-to-Noise Ratio (dB)4 6 8 10 12 14 16 18 =10-4 PFA =10-6 PFA =10-10 PFA =10-12 PFA =10-8 Radar Systems Course 15 Detection 11/1/2010 IEEE New Hampshire SectionIEEE AES SocietyTree of Detection IssuesDetectionNon-FluctuatingMultiple pulsesSwerling IFluctuatingFluctuatingSingle PulseSquare Law DetectorCoherentIntegrationSingle PulseDecisionBinaryIntegrationNon-Cohere ntIntegrationLinear DetectorNon-FluctuatingUncorrelatedSwerl ing IISwerling IIIS werling IVFully CorrelatedPartially CorrelatedRadar Systems Course 16 Detection 11/1/2010 IEEE New Hampshire SectionIEEE AES SocietyDetection Calculation MethodologyProbability of Detection vs.
7 Probability of False Alarm and Signal-to-Noise RatioDetermine PDF at Detector Output Single pulse Fixed S/NIntegrate N fixed target pulsesScan to Scan Fluctuations (Swerling Case I and III)Pulse to Pulse Fluctuations (Swerling Case II and IV)Average over signal fluctuationsIntegrate over N pulsesAverage over target fluctuationsIntegrate from threshold, T, to PD vs. PFA , S/N, &Number of pulses, NRadar Systems Course 17 Detection 11/1/2010 IEEE New Hampshire SectionIEEE AES SocietyOutline Basic concepts Integration of pulses Fluctuating targets Constant false alarm rate (CFAR) thresholding SummaryRadar Systems Course 18 Detection 11/1/2010 IEEE New Hampshire SectionIEEE AES SocietyIntegration of Radar PulsesDetection performance can be improved by integrating multiple pulsesCalculateThresholdCalculateCoheren t IntegrationNoncoherent Integration Adds voltages , then square Phase is preserved pulse-to-pulse phase coherence required SNR Improvement = 10 log10 N Adds powers not voltages Phase neither preserved nor required Easier to implement, not as > =TxN1N1n2n> =SumCalculateThresholdPulses.
8 2N1nnx =nxNx2x1x1xNx21xCalculate22xCalculate2Nx 2x =N1n2nxTarget DetectionDeclared ifTarget DetectionDeclared ifRadar Systems Course 19 Detection 11/1/2010 IEEE New Hampshire SectionIEEE AES SocietyIntegration of PulsesSignal to Noise Ratio per Pulse (dB)0 5 10 15 Probability of Most Cases, Coherent Integration is More Efficientthan Non-Coherent Integration =10-6 One PulseTen PulsesCoherent IntegrationTen PulsesNon-Coherent IntegrationCoherentIntegrationGainNon-Co herentIntegrationGainRadar Systems Course 20 Detection 11/1/2010 IEEE New Hampshire SectionIEEE AES SocietyDifferent Types of Non-Coherent Integration Non-Coherent Integration Also called ( video integration ) Generate magnitude for each of N pulses Add magnitudes and then threshold Binary Integration (M-of-N Detection ) Separately threshold each pulse 1 if signal > threshold.
9 0 otherwise Count number of threshold crossings (the # of 1s) Threshold this sum of threshold crossings Simpler to implement than coherent and non-coherent Cumulative Detection (1-of-N Detection ) Similar to Binary Integration Require at least 1 threshold crossing for N pulsesRadar Systems Course 21 Detection 11/1/2010 IEEE New Hampshire SectionIEEE AES SocietyCalculateBinary (M-of-N) 1 Pulse 2 PulseThresholdTThresholdT2nd ThresholdMIndividual pulse detectors:Target present if at least M detections in N pulses1x1iNx2x1i,Txn2n= ==N1nnimN2nd thresholding :2iNi0i,Txn2n=<Mm Mm<, target present, target absentAt LeastM of NDetectionsAt Least1 of N()()kNkNMkN/Mp1p!kN!k!NP = = ()NCp11P =21xCalculate22xCalculate2 NxBinary IntegrationCumulative DetectionRadar Systems Course 22 Detection 11/1/2010 IEEE New Hampshire SectionIEEE AES SocietyDetection Statistics for Binary Integration Signal to Noise Ratio per Pulse (dB)Probability of Detection2 4 6 8 10 12 1/4 = 1 Detection Out of 4 PulsesSteady(Non-Fluctuating ) TargetPFA =10-6 Radar Systems Course 23 Detection 11/1/2010 IEEE New Hampshire SectionIEEE AES SocietyOptimum M for Binary IntegrationOptimum M110100110100 Number of PulsesSteady(Non-Fluctuating ) TargetPD = =10-6 For each binary Integrator, M/N,there exists an optimum MM (optimum)
10 Systems Course 24 Detection 11/1/2010 IEEE New Hampshire SectionIEEE AES SocietyOptimum M for Binary Integration Optimum M varies somewhat with target fluctuation model, PD and PFA Parameters for Estimating MOPT = Na 10bAdapted from Shnidman in Richards, reference 7 Target Fluctuations a b Range of NNo Fluctuations - 5 700 Swerling I - 6 500 Swerling II - 9 700 Swerling III - 6 700 Swerling IV - 10 700 Radar Systems Course 25 Detection 11/1/2010 IEEE New Hampshire SectionIEEE AES SocietyDetection Statistics for Different Types of IntegrationPFA =10-6 Coherent and Non-Coherent Integration2 4 6 8 10 12 14 PulsesNon-CoherentIntegration4 PulsesBinaryIntegration3 of 4 PulsesSingle PulseSignal to Noise Ratio (dB)