Transcription of RAINFALL TABLES FOR NORTH CENTRAL TEXAS
1 APPENDIX A iSWMTM Design Manual for Site Development A-1 RAINFALL TABLES FOR NORTH CENTRAL TEXAS Methodology ..A-2 Figure Figure A-1 County RAINFALL Data Location A-4 TABLES Table A-1 Collin County .. A-5 Table A-2 Dallas County .. A-6 Table A-3 Denton County .. A-7 Table A-4 Ellis A-8 Table A-5 Erath A-9 Table A-6 Grayson County .. A-10 Table A-7 Hood A-11 Table A-8 Hunt A-12 Table A-9 Johnson County.
2 A-13 Table A-10 Kaufman County .. A-14 Table A-11 Navarro County ..A-15 Table A-12 Palo Pinto County ..A-16 Table A-13 Parker A-17 Table A-14 Rockwall County ..A-18 Table A-15 Somervell Table A-16 Tarrant County .. A-20 Table A-17 Wise A-21 Table A-18 500-Year Storm .. A-23 Appendix A January 2006 A-2 iSWMTM Design Manual for Site Development Methodology The US Geological Survey (USGS), in cooperation with the TEXAS Department of Transportation (TxDOT), recently conducted a study of the depth-duration frequency (DDF) of precipitation for Texas1.
3 In the study, the frequency of the annual maximum RAINFALL data was modeled using two probability distributions. The parameters from these distributions can be used to estimate the DDF for any location in TEXAS . The results of the study were applied to the hydrologic models used to update the Flood Insurance Rate Maps of Harris County. The City of Austin also asked the USGS for data to update its IDF data. TxDOT will also be updating its intensity-duration frequency (IDF) data statewide. Depth-duration frequency relationships were obtained from the USGS for each county in the NORTH CENTRAL TEXAS region.
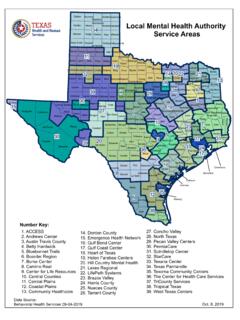
4 The centroid of each county was used as the geographic location for the computations as shown on Figure A-1. The frequency range in the USGS study is from 2 to 500 years and precipitation duration ranges from 15-minutes to 24 hours. The main objective was to find IDF relationships for each of the counties. The results are presented in tabular form in this Appendix for each county. The main procedure for developing the IDF relationship is shown below. 1. Convert RAINFALL depths to intensities for each associated duration.
5 2. Plot intensity vs. duration for each return period on log-log axes. 3. Follow the Dodson Method2 to develop the IDF relationship shown below. ()edTbI+= In the equation above, I represents the RAINFALL intensity in inches/hr, T represents the RAINFALL duration in minutes, and b, d, and e are coefficients. 4. Determine the IDF relationship for each county in the NORTH CENTRAL TEXAS region, for each return period. Since it was necessary for the IDF relationships to represent durations less than 15 minutes, the RAINFALL depths from Hydro-353 were obtained for 5 and 10-minute durations.
6 This provided for a smooth transition between the Hydro-35 data and the USGS data. It was also necessary to develop IDF relationships for the 1-year return period. The procedure that was followed to determine the DDF relationship for each 1-year curve is listed below. 1. Plot depth vs. return period for each duration. (Each curve stops at the 2-year return period.). 2. Extrapolate each curve to the 1-year return period. 3. Convert the extrapolated depths to intensities. In step 1, the 5 and 10-minute curves were developed using Hydro-35 data, whereas the USGS data was used to develop curves for durations greater than 10 minutes.
7 The extrapolated intensities were then used to develop the 1-year IDF relationship for each county. January 2006 Appendix A iSWMTM Design Manual for Site Development A-3 Other Comments The process of developing IDF relationships involved the merging of DDF data from two different studies. Hydro-35 was published in 1977, but the fitting procedure used for the frequency distribution was developed in 1958. The common practice at the time was to fit the annual series to a distribution, then apply correction factors to convert to partial-duration series.
8 These empirical factors were used to modify the statistics of the distribution to more closely represent actual precipitation data. In the USGS publication (1998), the annual series data was also used, but no conversion was deemed necessary, for the following reasons. First, a greater number of stations and longer periods of records were available at the time of the study. Also, two different distributions were applied for different duration ranges. These distributions were developed more recently (1986, 1990), and make use of L-moments (linear moments), which are more powerful than traditional statistics (mean, standard deviation).
9 As a result of using more advanced statistical analyses, the selected distributions modeled the annual series without the use of conversion factors. The values reported in the IDF TABLES are calculated directly from the fitted IDF equations. The fitted equations are only valid for RAINFALL durations between 5 minutes and 24 hours. 1 Asquith, Depth-Duration Frequency of Precipitation for TEXAS . Water-Resources Investigations Report 98-4044, US Geological Survey. Austin, TX, 1998. 2 Frederick, , Myers, and Auciello.
10 NOAA Technical Memorandum NWS Hydro-35. Office of Hydrology. Silver Spring, MD, June 1977. 3 The Dodson Hydrology Library. Dodson & Associates, Inc. Houston, TX, 1987. Appendix A January 2006 A-4 iSWMTM Design Manual for Site Development January 2006 Appendix A iSWMTM Design Manual for Site Development A-5 Table A-1 Collin County Return Period (Years) Coefficents 1 2 5 10 25 50 100 e b d 9 9 11 11 11 11 11 Hours