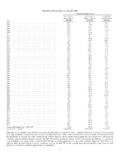
Transcription of REAL EARNINGS–SEPTEMBER 2018
1 Transmission of material in this release is embargoed until USDL-18-1279. 8:30 (EDT), Friday, August 10, 2018. Technical Information: (202) 691-6555 Media Contact: (202) 691-5902 real earnings JULY 2018. All employees real average hourly earnings for all employees were unchanged from June to July, seasonally adjusted, the Bureau of Labor Statistics reported today. This result stems from a increase in average hourly earnings combined with a increase in the Consumer Price Index for All Urban Consumers (CPI-U). real average weekly earnings decreased percent over the month due to no change in real average hourly earnings combined with a decrease in the average workweek.
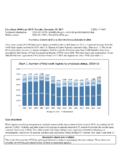
2 Chart 1: Over-the-month percentage change in real average hourly earnings for all employees, seasonally adjusted, July 2017 July 2018. Percent Change Jul '17 Aug Sep Oct Nov Dec Jan Feb Mar Apr May Jun Jul '18. real average hourly earnings decreased percent, seasonally adjusted, from July 2017 to July 2018. Combining the change in real average hourly earnings with the increase in the average workweek resulted in a increase in real average weekly earnings over this period. Production and nonsupervisory employees real average hourly earnings for production and nonsupervisory employees decreased percent from June to July, seasonally adjusted.
3 This result stems from a increase in average hourly earnings combined with a increase in the Consumer Price Index for Urban Wage Earners and Clerical Workers (CPI-W). After combining the change in real average hourly earnings with no change in average weekly hours, real average weekly earnings were unchanged over the month. Chart 2: Over-the-month percentage change in real average hourly earnings for production and nonsupervisory employees, seasonally adjusted, July 2017 July 2018. Percent Change Jul '17 Aug Sep Oct Nov Dec Jan Feb Mar Apr May Jun Jul '18.
4 From July 2017 to July 2018, real average hourly earnings decreased percent, seasonally adjusted. Combining the change in real average hourly earnings with a increase in the average workweek resulted in a decrease in real average weekly earnings over this period. _____. real earnings for August 2018 is scheduled to be released on Thursday, September 13, 2018 at 8:30 (EDT). -2- Table A-1. Current and real (constant 1982-1984 dollars) earnings for all employees on private nonfarm payrolls, seasonally adjusted July May June July 2017 2018 2018p 2018p real average hourly.
5 $ $ $ $ real average weekly earnings1.. $ $ $ $ Consumer Price Index for All Urban Consumers.. average hourly earnings .. $ $ $ $ average weekly . average weekly earnings .. $ $ $ $ OVER-THE-MONTH PERCENT CHANGE. real average hourly . real average weekly earnings1.. Consumer Price Index for All Urban Consumers.. average hourly earnings .. average weekly . average weekly earnings .. OVER-THE-YEAR PERCENT CHANGE. real average hourly . real average weekly earnings1.. Consumer Price Index for All Urban Consumers.. average hourly earnings .. average weekly.
6 average weekly earnings .. 1. The Consumer Price Index for All Urban Consumers (CPI-U) is used to deflate the earnings series for all employees. p Preliminary Table A-2. Current and real (constant 1982-1984 dollars) earnings for production and nonsupervisory employees on private nonfarm payrolls, seasonally adjusted1. July May June July 2017 2018 2018p 2018p real average hourly . $ $ $ $ real average weekly earnings2.. $ $ $ $ Consumer Price Index for Urban Wage Earners and Clerical Workers.. average hourly earnings .. $ $ $ $ average weekly.
7 average weekly earnings .. $ $ $ $ OVER-THE-MONTH PERCENT CHANGE. real average hourly . real average weekly earnings2.. Consumer Price Index for Urban Wage Earners and Clerical Workers.. average hourly earnings .. average weekly . average weekly earnings .. OVER-THE-YEAR PERCENT CHANGE. real average hourly . real average weekly earnings2.. Consumer Price Index for Urban Wage Earners and Clerical Workers.. average hourly earnings .. average weekly . average weekly earnings .. 1. Data relate to production employees in mining and logging and manufacturing, construction employees in construction, and nonsupervisory employees in the service-providing industries.
8 These groups account for approximately four-fifths of the total employment on private nonfarm payrolls. 2. The Consumer Price Index for Urban Wage Earners and Clerical Workers (CPI-W) is used to deflate the earnings series for production and nonsupervisory employees. p Preliminary Technical Note The earnings series presented in this release are There are several characteristics of the series derived from the Bureau of Labor Statistics' presented in this release that limit their suitability Current Employment Statistics (CES) survey, for some types of economic analyses.
9 (1) The a monthly establishment survey of employment, denominator for the all employee weekly earnings payroll, and hours. The deflators used for constant- series is the number of private nonfarm jobs. dollar earnings series presented in this release come Similarly, the denominator of the production from the Consumer Price Indexes Program. The and nonsupervisory employee weekly earnings Consumer Price Index for All Urban Consumers series is the number of private nonfarm (CPI-U) is used to deflate earnings for the all production and nonsupervisory employee jobs.
10 This employees series, while the Consumer Price Index number includes full-time and part-time jobs as well as for Urban Wage Earners and Clerical Workers the jobs held by multiple jobholders in the (CPI-W) is used to deflate earnings for the private nonfarm sector. These factors tend to result in production and nonsupervisory employees series. weekly earnings averages significantly lower Seasonally adjusted data are used for than the corresponding numbers for full-time jobs. estimates of percent change from the same month (2) Annual earnings averages can differ a year ago for current and constant average hourly significantly from the result obtained by and weekly earnings .