Transcription of REMOTE SENSING EXAM 1: STUDY GUIDE
1 REMOTE SENSING EXAM 1: STUDY GUIDE Electromagnetic Spectrum Everything with heat (>0 K) with heat (>0 K) emits Electromagnetic Radiation (EMR) EMR is a combination of electrical and magnetic waves Waveform Sinusoidal Speed of light c (c=3X10⁸ m/sec) c= (lambda)v v= frequency (# waves per unit time) ( )= wavelength Regions of the Electromagetic Spectrum (EMS) Radiation Laws Isaac Newton, Max Plank, Albert Einstein studied (EMR). Plank found that EMR emitted and absorbed as found that EMR emitted and absorbed as discrete bundles of energy called photons or quanta . The size of each unit is proportional to frequency And is a measure of the energy at that frequency Everything > 0 K emits energy Energy is subsequently re-emitted emitted at longer wavelength at longer wavelength Q (radiant energy, J) = h * v h = constant v = frequency (waves per sec.)
2 F( temperature, material properties) Stefan-Boltzmann law The energy radiated by a blackbody radiator per second per energy radiated by a blackbody radiator per second per unit area is proportional to the fourth power of the absolute temperature. (1) M= T4 (a) M = total radiance in Watts/cm2 (b) = SB constant ( x 10-8 * Wm-2 * K-4) (c) T = temperature in K (i) note the importance of 4th power (d) Total energy emitted rises v rapidly as T rise Wien s Displacement Law Distribution of this energy not uniform over the EMS of this energy not uniform over the EMS shift toward shorter wavelength with increasing T. Peak of the curve is called the dominant wavelength States that as a bodies T rises, more energy given per unit area per unit area. Example - Earth s ambient T = 300 K (27 C, 80 F) Lambda( ) = 2898 / 300 = Lambda ( ) = A/T - Lambda( ) = wavelength of maximum emitance - A = 2898 m * K - T = temperature Energy Interactions with the atmosphere SCATTERING Rayeigh Scattering Particles << Wavelength ( ) Greatest at high altitude Primarily caused by Oxygen & Nitrogen Scattering inversely proportional to 4th power of shorter waveleng y gths scattered much more readily blue scattered 4x's more than green 16x's more than Red Green scattered 4x more than red etc.
3 Blue sky & Red sunsets Significant in clear skies Causes haze, reduces contrast and sharpness Mie Scattering Particles >= Wavelength Lot of scattering in visible portion Tends to affect longer ( ) than Rayleigh Water vapor, dust, ash, smoke More complex than Rayleigh Significant in overcast skies Greatest in lower in lower atmosphere (0-5 km.) Nonselective Scattering Particles >> wavelength Water droplets, Ice, Fog, Haze not wavelength dependent wavelength dependent we see grayish haze nonselective WRT ( ) effects all equally Effects of Scattering light in shadows reduction of contrast colors different wavelengths removed with increased distance Remediation filters remove blue portions & UV Absorption (Energy interactions with the atmosphere) Wavelength selective Bands Transmission bands Atmospheric Windows Absorption Bands Specific wavelengths are blocked by specific gasses H20, CO2, & O3 mostly Refraction (Energy interactions with the atmosphere) -Different densities -Glass lenses bend light -Atmosphere does too -Changes density from earth to space -Also changes, with variations in T, humidity -Example.
4 Why the sun seems to stay on horizon long time, then disappear quickly. -As light passes into denser medium it is bent toward it ENERGY-MATTER INTERACTION Energy can be; (1) Transmitted (2) Reflected (3) Absorbed by matter as f ( ) EI ( ) = ET ( ) + ER ( ) + EA ( ) EI = incident radiant energy ER = energy reflected ET = energy transmitted EA = energy absorbed REFLECTION What we observe is what is reflected (visible spectrum) divided into 3 segments, called Additive Primaries Red, Green, Blue No addition of 2 colors can make these Additions of primaries make other colors Equal proportions of each make white light Specular (like a mirror) 100% of energy reflects off at an opposite angle. Diffuse energy reflects off equally in all directions (Lambertian Reflector) Which happens is f (wavelength, surface roughness) Thus, at one ( ) may be specular & at another ( ) may be diffuse Combination of above (Near-Perfect Specular & Near-Perfect Diffuse) Most common EMR SURFACE INTERACTION Spectral Reflectance -Expressed as a percentage -Average admittance of incident radiation reflected by an object.
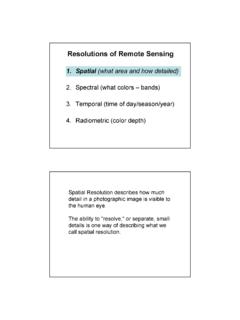
5 -admittance reflected / admittance in * 100 = percentage Spectral Signatures -"Fingerprint -Be careful in using this -time of year (temporal effects) -mixtures (spatial effects) DATA ACQUISITION Detection Record Photo both detecting & recording medium Digital separate recording & detecting medium Interpret Visual Qualitative Experience important Spatial patterns easier for human brain to discern Digital Quantitative Spectral patterns easier to identify using computer DIGITAL NUMBERS (DN) 4 TYPES of RESOLUTION Spatial Area covered / detected, Usually by a single pixel or film emulsion) Spectral The region of the EMS data / imagery collected Temporal Days/times imagery acquired (Landsat, flown once every 16 days!) Radiometric # of Bits of the data Spatial Resolution Multi-Stage RS Radiometric Resolution Data according to # of Bits Ideal REMOTE SENSING System (Nowhere near it, or is it Possible) Uniform energy source Noninterfering atmosphere Unique energy-matter interactions Supersensor Real-time data handling system Multiple data user Global Positioning Systems Noise second recalculations Bias governmental error on purpose Blunder human error Elements of Photographic Systems Advantages Improved vantage point Capability to stop action Permanent recording Broadened spectral sensitivity (compared to our eyes)
6 Increased spectral resolution & geometric fidelity Disadvantages Restricted to range Restricted by weather/lighting conditions Non-digital format Photo products available Black & White Panchromatic Black & White Infrared Panchromatic Black & White infrared Color Color Color IR Positives Transparencies Negatives Factors influencing exposure Scene brightness Diameter of lens opening (aperture) f-stop ratio of focal length to aperture diameter Each f-stop in succession allows 2x s less light in (left-to-right below) , 2, , 4, , 8, 11, Doubling the f-stop results in 4x s the light Exposure time Again, each increment allows 2x s more /less light in 1/1000second, 1/500s, 1/250s, 1/125s, 1/60s, etc Focal length (Determines angular field of view) Camera Types Vertical frame Oblique -High see horizon -Low no horizon Reconnaissance Large format Metric Multi-lens Strip Panoramic Panoramic Camera Color Film Color IR Film Color IR Color Matching Blue isn t recorded = Black Green = Blue Red = Green Near IR = Red Filters Non-photographic systems Digital cameras Uses CD s - silicon chip that produces electrical charge CMOS (Complementary Metal Oxide Semiconductor) Lower power consumption Direct analog-digital conversion Built-in Slightly poorer image quality (but improving) Video (videography)
7 Advantages Immediate viewing, low cost, can be digitally processed Disadvantages Resolution poor Limited spectral range - Vidicon - whole scene at once Image Interpretation Products, equipment determine how What to be done? Counting Delineation Classification System Minimum Mapping Unit (mmu) Once system and mmu decided, begin delineation between units Start with obvious (high contrast) and work toward more detail Photomorphic regions Fuzzy edge - Milar Land Land use/Land cover (LULC) mapping Land cover the type of feature present on the surface of the earth. Forest, corn field, asphalt, etc Land use the human activity or economic function associated with a specific parcel of land. Urban, agriculture, parking lot The land use class residential might have land cover categories of grass trees concrete and of roofs.
8 Ideally shown on separate maps, but not practical. USGS Calcification System Developed in 1970 s 4 Different levels of detail For different REMOTE SENSING products And mmu s Levels I & II For regional state national scales of mapping 5-100m+ spatial resolution Satellite data, small scale air photos Levels III & IV For very detailed mapping <5 spatial resolution Medium to large scale air photos & high resolution satellite USGS National Gap Analysis Program (GAP) Provide consistent state, regional, & national level data; natural vegetation. Provides info about regions where species and communities are not adequately represented in the existing network of lands subject to conservation practices. Multi-resolution Land Characteristics consortium (MRLC) Interagency (USGS, GAP, NAQWA, EPA, NOAA, etc) Develop a 30m res.
9 TM & LULC Data set for entire US Centered on 1992 data Elements of Image Interpretation Shape general form, configuration outline of objects Size in consideration of image scale Pattern spatial arrangement (orchard, cemetary, etc) Tone & hue brightness or color (spectral response) Texture frequency of tonal change Shadows shape or outline Site topographic or geographic location Association relation to other features Resolution practical limits of interpretation Image Interpretation Keys Selective key Photos of comparable objects of comparable objects (comparison) Elimination key Dichotomous key (True or false) Keys developed for developed for; Certain areas, certain cover types, certain time of year Keys cannot be used except for their original design