Transcription of Renewable Energy in Ireland - Sustainable Energy Authority ...
1 Renewable Energy IN IRELAND2020 UpdateRENEWABLE Energy IN IRELAND2020 Report1 Renewable Energy IN Ireland 2020 ReportApril 2020 Renewable Energy IN IRELAND2020 Report2 Sustainable Energy Authority of IrelandThe Sustainable Energy Authority of Ireland (SEAI) is Ireland s national Energy Authority , investing in and delivering appropriate, effective and Sustainable solutions to help Ireland s transition to a clean Energy future. We work with the Government, homeowners, businesses and communities to achieve this, through expertise, funding, educational programmes, policy advice, research and the development of new technologies. SEAI is funded by the Government of Ireland through the Department of Communications, Climate Action and is the official source of Energy data for Ireland .
2 We develop and maintain comprehensive national and sectoral statistics for Energy production, transformation and end-use. These data are a vital input in meeting international reporting obligations, advising policymakers and informing investment decisions. SEAI s core statistics functions are to: Collect, process and publish Energy statistics to support policy analysis and development in line with national needs and international obligations Conduct statistical and economic analyses of Energy services sectors and Sustainable Energy options Contribute to the development and promulgation of appropriate sustainability gratefully acknowledges the cooperation of all the organisations, agencies, Energy suppliers and distributors that provided data and responded to questionnaires throughout the year.
3 Sustainable Energy Authority of IrelandReproduction of the contents is permissible provided that the source is Energy IN IRELAND2020 Report32018 HighlightsProgress towards targets Overall Renewable Energy supply was 11% of gross final consumption. Ireland has a binding EU target of 16% by 2020. Ireland is not on track to meet 2020 Renewable Energy targets. Ireland had the second lowest progress to meeting the overall RES target of all EU Member States. The share of Renewable transport Energy (RES-T), including adjustments, was Ireland has a binding EU target of 10% by 2020. The share of Renewable electricity (RES-E) was Ireland has a national target of 40% by 2020. The share of Renewable heat (RES-H) was Ireland has a national target of 12% by of Renewable Energy The use of Renewable Energy displaced fossil fuel use equivalent to 2 million tonnes of oil and avoided million tonnes of CO2 emissions.
4 This was equivalent to 13% of total Energy -related CO2 emissions. 82% of CO2 emissions avoided from the use of Renewable Energy were from electricity generation. Reducing the carbon intensity of electricity is critical for meeting Ireland s climate change transport More than 98% of RES-T was from bioenergy, almost 88% was from biodiesel and 10% was from biogasoline. 82% of liquid biofuels used in transport were imported. 1% of Renewable transport Energy is from electricity. Most electricity used for transport is used by DART and Luas, but electricity for cars is growing rapidly as Ireland 's fleet of electric vehicles grows quickly from a low base. Ireland was 13th out of the EU-28 for heat The amount of Renewable Energy used for heat increased by 65% between 2005 and 2018, albeit from a low base.
5 Renewable ambient Energy captured by heat-pumps increased by 182% between 2010 and 2018. There has been a large increase in the use of air-source heat-pumps in the residential sector. Ireland had the second lowest share of Renewable heat of all EU Member States. Ireland 's poor performance in Renewable heat is the biggest reason for us failing to achieve our overall Renewable Energy electricity 66% of Renewable Energy in 2018 was Renewable electricity. Renewable electricity forms the backbone of Ireland s strategy to achieve the overall Renewable Energy target for 2020. Wind generated 28% of all electricity in 2018, second only to natural gas. Ireland is a world leader at incorporating large amounts of wind-generated electricity onto the network.
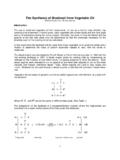
6 358 MW of additional wind-generation capacity was installed in 2018. Other Renewable electricity sources were: hydro , bioenergy (biomass, biogas and landfill gas) , Renewable waste and solar PV Ireland was 12th out of the EU-28 for Energy IN IRELAND2020 Report4 Renewable Energy in IrelandData from 2018 Ireland is not on track to meet 2020 Renewable Energy targetsin avoided CO2 emissions from Renewable Energy which is equivalent to removing of private cars off the Energy TARGETS2020 TARGETS RES target point increase from 2017 to 2018 point increase from 2017 to 2018 point decrease from 2017 to 2018 point decrease from 2017 to 2018To download the full report, visit MtCO2of this was avoided from Renewable electricityRENEWABLE Energy IN IRELAND2020 Report5 RENEWABLES 3%RENEWABLES 33%FOSSIL FUELS FUELS 97%FOSSIL FUELS 67%TRANSPORT1 million electric vehicles on the road by 2030 Climate Action Plan new diesel-only public buses in our citiesExpand our network of cycle paths and park & ride facilities+75%renewable600.
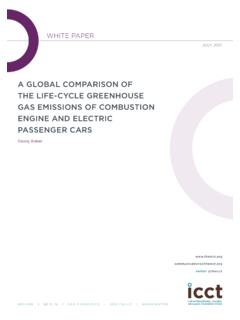
7 000 Climate Action Plan pumpsheat pumps installed by 2030 HEATI reland is27thout of the 28 EU countries for Renewable heatof Renewable heat is used in industrymost of this is biomass64%70%ELECTRICITYC limate Action Plan has the2nd highestshare of wind-generated electricity in the EU at 28%of electricity from renewables by 2030 Phase out coal and peat for electricity generationRENEWABLE Energy IN IRELAND2020 Report6A few changes can make a big difference:What can YOU do?To find out more how you can take climate action visit: replacing your car, consider going a BER rating for your home to understand what upgrades could be done to improve your Energy your home. This could include increased attic, wall and floor , cycle, use public transport or carpool where Energy waste is key to reducing your impact.
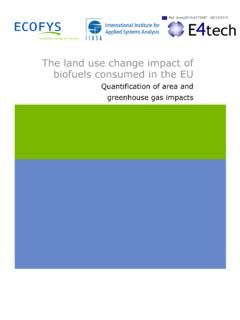
8 The less Energy you use, the less Energy that needs to be produced in the first place. So efficiency first!Take climate action Conversations with your family, friends and work colleagues can have a big impact. Help them make better Energy decisions. If you think your community could benefit from getting involved in saving Energy , find out about the SEAI Sustainable communities Energy USE43%Private car use35%Space heating11%Water heating12%Cooking, lighting, appliancesThen consider Renewable Energy sources such as a heatpump or solar Energy IN IRELAND2020 Report7 Table of contents2018 Highlights 31 Overall Renewable Energy Progress towards Renewable Energy targets Renewables in the context of overall Energy use 122 Displacement of fossil fuels and CO2 emissions Avoided CO2 emissions Contribution to indigenous Energy 143 Renewable Energy in transport Progress towards Renewable transport target Biofuels Renewable electricity in transport 194 Renewable Energy in heat Progress towards Renewable heat target Solid biomass and Renewable waste Biogas Ambient Energy from heat pumps Solar thermal 245 Renewable Energy in electricity
9 Progress towards Renewable electricity target Wind Energy Installed wind capacity Capacity factors Normalisation of wind Energy Hydro Energy Installed hydro capacity Normalisation of hydro Energy Pumped hydro storage Solid biomass Renewable waste Landfill gas Biogas Solar photovoltaic 306 EU comparison Gross final consumption in EU by heat, transport and electricity Overall RES Renewable heat Renewable electricity Renewable transport 35 Glossary of abbreviations 36 Glossary of terms 37 Sources 39 Appendix 1: Methodology for calculating Renewable Energy shares 40 Appendix 2: Displacement of fossil fuels by Renewable Energy 43 Renewable Energy IN IRELAND2020 Report8 Table of FiguresFigure 1: Renewable Energy (normalised) by mode, 2000 to 2018 10 Figure 2: Renewable and fossil GFC by mode, 2018 11 Figure 3: Renewable Energy use, 2000 to 2018 12 Figure 4: Renewable Energy status in Ireland , 2018 12 Figure 5: Avoided CO2 from Renewable Energy , 2005 to 2018 13 Figure 6: Indigenous Energy production by source, 1990 to 2018 14 Figure 7: Progress towards Renewable transport Energy target, 2005 to 2018 16 Figure 8: Renewable transport Energy (without weightings), 2005 to 2018 17 Figure 9: Biofuels production, imports and usage, 2005 to 2018 18 Figure 10: Electricity used in transport, 2000 to 2018 19 Figure 11.
10 Percentage RES-H by source, 2005 to 2018 20 Figure 12: Renewable heat Energy by sector, 2005 to 2018 21 Figure 13: Solid biomass used for heat by sector, 2005 to 2018 22 Figure 14: Normalised share of RES-E by source, 2005 to 2018 25 Figure 15: Installed wind-generation capacity, 2000 to 2019 26 Figure 16: Monthly wind-generation capacity factors, 2019 27 Figure 17: Annual wind capacity factors, 2005 to 2019 28 Figure 18: Normalised wind-powered electricity generation, 2005 to 2019 28 Figure 19: Normalised hydro-powered electricity generation, 2000 to 2019 29 Figure 20: Gross final consumption in EU by heat, transport and electricity, 2018 31 Figure 21: Overall Renewable Energy share in 2018 for EU Member States 32 Figure 22: Percentage of 2020 Renewable Energy target achieved in 2018 for EU Member States 32 Figure 23: Renewable heat share in 2018 for EU Member States 33 Figure 24: Renewable electricity share in 2018 for EU Member States 34 Figure 25: Renewable transport share in 2018 for EU Member States 35 Table of TablesTable 1: Progress towards Renewable Energy targets, 2000 to 2018 9 Table 2: Renewable Energy (normalised) by mode, 2000 to 2018 10 Table 3: Renewable Energy use by source, 2000 to 2018 11 Table 4: Progress towards Renewable transport target, 2005 to 2018 16 Table 5: Renewable transport Energy (without weightings) by source, 2010 to 2018 17 Table 6: Renewable transport Energy (with weightings) by source, 2010 to 2018 18 Table 7.