Transcription of Research Brief - Child Trends
1 ADVERSE CHILDHOOD EXPERIENCES:NATIONAL AND STATE-LEVEL PREVALENCE Vanessa Sacks, , David Murphey, , and Kristin Moore, Trends7315 Wisconsin Avenue Suite 1200 WBethesda, MD 20814 Phone 240-223-9200 childhood experiences (ACEs) are potentially traumatic events that can have negative, lasting effects on health and well-being. These experiences range from physical, emotional, or sexual abuse to parental divorce or the incarceration of a parent or guardian. A growing body of Research has sought to quantify the prevalence of adverse childhood experiences and illuminate their connection with negative behavioral and health outcomes, such as obesity, alcoholism, and depression, later in life. However, prior Research has not reported on the prevalence of ACEs among children in a nationally representative, non-clinical sample.
2 In this Brief , we describe the prevalence of one or more ACEs among children ages birth through 17, as reported by their parents, using nationally representative data from the 2011/12 National Survey of Children s Health (NSCH). We estimate the prevalence of eight specific ACEs for the , contrasting the prevalence of specific ACEs among the states and between children of different age groups. KEY FINDINGS Economic hardship is the most common adverse childhood experience (ACE) reportednationally and in almost all states, followed by divorce or separation of a parent orguardian. Only in Iowa, Michigan, and Vermont is divorce or separation more commonthan economic hardship; in the District of Columbia, having been the victim of orwitness to violence has the second-highest prevalence, after economic hardship.
3 The prevalence of ACEs increases with a Child s age (parents were asked whether theirchild had ever had the experience), except for economic hardship, reported aboutequally for children of all ages, reflecting high levels of poverty among young families. Abuse of alcohol or drugs, exposure to neighborhood violence, and the occurrence ofmental illness are among the most commonly-reported adverse childhood experiences inevery state. Just under half (46 percent) of children in the have experienced at least one ACE. In16 states, a slight majority of children have experienced at least one ACE. In Connecticut,Maryland, and New Jersey, 60 percent or more of children have never experienced an ACE. States vary in the pattern of specific ACEs. Connecticut and New Jersey have some of thelowest prevalence rates nationally for all ACEs, while Oklahoma has consistently BriefJuly 2014 Publication #2014-282 ResearchBriefAdverse Childhood Experiences:NATIONAL AND STATE-LEVEL PREVALENCE Research BriefMEASUREMENT OF ADVERSE CHILDHOOD EXPERIENCESWe measured the prevalence of eight adverse childhood experiences (ACEs), consisting of whether the Child ever: 1.
4 Lived with a parent or guardian who got divorced or separated; 2. Lived with a parent or guardian who died;3. Lived with a parent or guardian who served time in jail or prison;4. Lived with anyone who was mentally ill or suicidal, or severely depressed for more than a couple of weeks;5. Lived with anyone who had a problem with alcohol or drugs;6. Witnessed a parent, guardian, or other adult in the household behaving violently toward another ( , slapping, hitting, kicking, punching , or beating each other up);7. Was ever the victim of violence or witnessed any violence in his or her neighborhood; and8. Experienced economic hardship somewhat often or very often ( , the family found it hard to cover costs of food and housing).State-Level Variation in the Prevalence of Adverse Childhood Experiences Research has found that the highest levels of risk for negative outcomes are associated with having experienced multiple adverse childhood experiences (ACEs).
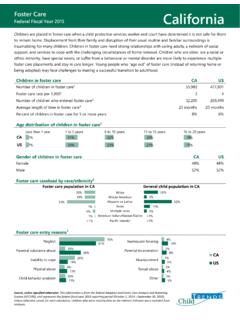
5 , Table 1 shows the number of ACEs parents reported for their Child , by state. Nationally, a slight majority of children have not experienced any ACEs, but in 16 states more than half of children have experienced at least one ACE. In Montana and Oklahoma, 17 percent of children have experienced three or more ACEs. Some studies suggest that the experience of four or more ACES is a threshold above which there is a particularly higher risk of negative physical and mental health outcomes. , Prevalence at this threshold is lowest in New Jersey and New York, at around three percent, and highest in Oklahoma, Montana, and West Virginia, at 10 to 12 percent (data not shown in Table). 3 ResearchBriefAdverse Childhood Experiences:NATIONAL AND STATE-LEVEL PREVALENCE Research BriefStateNumber Of Adverse Childhood Experiences01 OR 23+United States543511 Alaska513514 Alabama484012 Arkansas454114 Arizona444015 California57339 Colorado573310 Connecticut61327 District of Columbia513711 Delaware523513 Florida49429 Georgia53389 Hawaii56359 Iowa553312 Idaho503515 Illinois59329 Indiana493615 Kansas543412 Kentucky463716 Louisiana503812 Massachusetts58339 Maryland61318 Maine483715 Michigan513514 Minnesota563410 Missouri523512 Mississippi463915 Montana483517 North Carolina523612 North Dakota583210 Nebraska563211 New Hampshire553312 New Jersey61327 New Mexico473914 Nevada474013 Table 1.
6 Among Children Aged Birth to 17, Percentage Reported to Have Had Zero, One or Two, or Three or More Adverse Childhood Experiences (ACEs), Nationally, and by State4 ResearchBriefAdverse Childhood Experiences:NATIONAL AND STATE-LEVEL PREVALENCE Research BriefStateNUMBER OF ADVERSE CHILDHOOD EXPERIENCES01 OR 23+New York58348 Ohio503614 Oklahoma453817 Oregon503515 Pennsylvania543412 Rhode Island533711 South Carolina493912 South Dakota583011 Tennessee483813 Tex a s543610 Utah59319 Virginia58348 Vermont503811 Washington533611 Wisconsin543511 West Virginia483616 Wyoming523415 Table 1. Among Children Aged Birth to 17, Percentage Reported to Have Had Zero, One or Two, or Three or More Adverse Childhood Experiences (ACEs), Nationally, and by StateEconomic Hardship is the Most Common Adverse Childhood ExperienceBy far, the most common ACEs in all 50 states are economic hardship, and parental divorce or separation (Table 2).
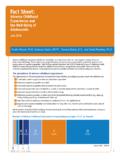
7 Nationally, just over one in four children ages birth through 17 has experienced economic hardship somewhat or very often. Only in Iowa, Michigan, and Vermont is divorce more prevalent than economic hardship (in Wyoming and Oklahoma they are equally prevalent). In most states (45), living with a parent who has an alcohol- or drug-use problem is the third-most-prevalent ACE (national prevalence is about one in ten children). Death of a parent is experienced by three percent of children nationally and is relatively rare in all states: only in the District of Columbia and Mississippi is prevalence greater than five percent (seven and six percent, respectively). 5 ResearchBriefAdverse Childhood Experiences:NATIONAL AND STATE-LEVEL PREVALENCE Research BriefStateHighest2nd3rd4thUnited StatesEconomic Hardship (26)Divorce (20)Alcohol (11)Violence (9)Mental Illness (9)AlaskaEconomic Hardship (25)Divorce (24)Alcohol (15)Mental Illness (11)AlabamaEconomic Hardship (29)Divorce (23)Alcohol (11)Mental Illness (10)ArkansasEconomic Hardship (33)Divorce (26)Alcohol (13)Mental Illness (11)ArizonaEconomic Hardship (34)Divorce (24)Alcohol (16)Violence (11)CaliforniaEconomic Hardship (22)Divorce (17)Alcohol (11)Violence (8)ColoradoEconomic Hardship (23)Divorce (21)Alcohol (10)Mental Illness (9)ConnecticutEconomic Hardship (22)Divorce (16)Alcohol (8)Mental Illness (8)District of ColumbiaEconomic Hardship (24)Violence (17)Divorce (15)Incarceration (8)DelawareEconomic Hardship (25)Divorce (21)
8 Violence (12)Alcohol (7)FloridaEconomic Hardship (30)Divorce (20)Alcohol (9)Incarceration (8)GeorgiaEconomic Hardship (26)Divorce (19)Violence (8)Alcohol (8)Incarceration (8)Domestic Violence (7)HawaiiEconomic Hardship (21)Divorce (17)Violence (11)Alcohol (11)Domestic Violence (8)IowaDivorce (22)Economic Hardship (22)Alcohol (13)Mental Illness (13)Domestic Violence (8)IdahoEconomic Hardship (27)Divorce (25)Alcohol (14)Mental Illness (13)IllinoisEconomic Hardship (23)Divorce (16)Alcohol (9)Violence (8)IndianaEconomic Hardship (28)Divorce (24)Alcohol (13)Incarceration (11)Mental Illness (11)KansasEconomic Hardship (28)Divorce (22)Mental Illness (10)Alcohol (10)Violence (8)KentuckyEconomic Hardship (30)Divorce (29)Alcohol (14)Incarceration (13)LouisianaEconomic Hardship (27)Divorce (23)Mental Illness (10)Alcohol (10)Violence (10)Incarceration (8)MassachusettsEconomic Hardship (22)Divorce (19)Alcohol (11)Mental Illness (9)MarylandEconomic Hardship (20)Divorce (17)Alcohol (8)Violence (8) Mental Illness (7)MaineEconomic Hardship (29)Divorce (27)Alcohol (14)Mental Illness (13)MichiganDivorce (26)Economic Hardship (25)Alcohol (13)Mental Illness (11)MinnesotaEconomic Hardship (22)Divorce (20)Alcohol (13)Mental Illness (9)Table 2.
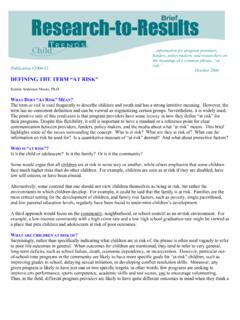
9 Four Most Common Adverse Childhood Experiences (and percentage prevalence) Among Children Ages Birth through 17, Nationally, and by State6 ResearchBriefAdverse Childhood Experiences:NATIONAL AND STATE-LEVEL PREVALENCE Research BriefStateHighest2nd3rd4thMissouriEconom ic Hardship (28)Divorce (23)Alcohol (11)Mental Illness (11) Violence (8)MississippiEconomic Hardship (32)Divorce (22)Alcohol (13)Violence (12)MontanaEconomic Hardship (28)Divorce (26)Alcohol (19)Mental Illness (14)North CarolinaEconomic Hardship (27)Divorce (21)Mental Illness (10) Violence (10) Alcohol (10)Domestic Violence (9)North DakotaEconomic Hardship (22)Divorce (20)Alcohol (13)Mental Illness (10)NebraskaEconomic Hardship (22)Divorce (21)Alcohol (12)Incarceration (9)New HampshireEconomic Hardship (23)Divorce (22)Alcohol (12)Mental Illness (11)New JerseyEconomic Hardship (22)Divorce (15)Alcohol (9)Mental Illness (6)New MexicoEconomic Hardship (28)Divorce (25)Alcohol (17)Violence (12)
10 NevadaEconomic Hardship (30)Divorce (23)Alcohol (13)Mental Illness (10)New YorkEconomic Hardship (22)Divorce (15)Violence (10)Domestic Violence (7)OhioEconomic Hardship (27)Divorce (23)Violence (13)Alcohol (12)OklahomaEconomic Hardship (30) Divorce (30)Alcohol (17)Violence (13)Mental Illness (12)OregonEconomic Hardship (29)Divorce (23)Alcohol (17)Mental Illness (14)PennsylvaniaEconomic Hardship (25)Divorce (19)Alcohol (10) Mental Illness (10)Violence (10) Domestic Violence (8)Rhode IslandEconomic Hardship (29)Divorce (19)Alcohol (12)Mental Illness (11)South CarolinaEconomic Hardship (27)Divorce (23)Alcohol (11)Mental Illness (10)South DakotaEconomic Hardship (21)Divorce (19)Alcohol (12)Incarceration (8)TennesseeEconomic Hardship (31)Divorce (25)Alcohol (12)Mental Illness (11)Tex a sEconomic Hardship (29)Divorce (20)Alcohol (10)Mental Illness (8)UtahEconomic Hardship (24)Divorce (17)Mental Illness (10) Alcohol (10)Domestic Violence (7)VirginiaEconomic Hardship (21)Divorce (18)Alcohol (8) Mental Illness (8)Violence (7)VermontDivorce (26)Economic Hardship (25)Alcohol (15)Mental Illness (11)WashingtonEconomic Hardship (25)Divorce (21)Alcohol (12) Mental Illness (12)Violence (9)WisconsinEconomic Hardship (25)Divorce (20)Alcohol (10) Mental Illness (10)Violence (8)West VirginiaEconomic Hardship (29)Divorce (28)Alcohol (14)Mental Illness (12)WyomingEconomic Hardship (25) Divorce (25)Alcohol (13) Mental Illness (13)Violence (10)Incarceration (9)Table 2.