Transcription of Research Brief - Legislative Council of Hong Kong
1 Research Brief Issue No. 6 2014 2015 Research Office Legislative Council Secretariat 1. Introduction Tourism (including both inbound and outbound tourism) is one of the four pillar industries in Hong Kong, along with financial services, trading and logistics, as well as professional and producer services. According to the latest statistics from the Census and Statistics Department, tourism contributed of GDP and provided 269 700 jobs or of total employment in 2013. Inbound tourism accounted for the majority share of the GDP contribution and total employment of the tourism industry, with the respective shares at 84% and 88% in 2013.
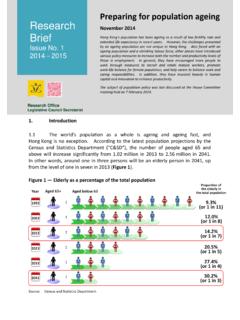
2 Visitor arrivals to Hong Kong registered a notable growth of to million in 2014, but this represented a deceleration from the annual average growth of during 2010-2013 (Figure 1). Visitor spending exhibited a similar moderating trend. In 2014, the per capita spending of same-day visitors increased by just to HK$2,414, much lower than the average annual growth of during 2010-2013. The per capita spending of higher value-added overnight visitors even decreased by to HK$7,960 in 2014, the first decline in 11 1 The percentage changes referred to in this Research Brief are year-on-year changes unless otherwise specified.
3 Year-on-year change means the percentage changes over the same period of the preceding year. 2 The per capita spending of overnight visitors had been on the rise since 2004 and peaked at HK$8,123 in 2013. Hong Kong's tourism industryAugust 2015 Growth in Hong Kong's inbound tourism eased in 2014. The slowdown continued and was more pronounced in the first half of 2015 as a result of slower Mainland visitor arrivals during the period. Yet other popular tourist destinations such as Japan and Europe have seen increased inflow of Mainland visitors, possibly because of their relaxed visa requirement and/or local currency depreciation against the US dollar. The recent setback in local inbound tourism reinforces the need for Hong Kong to diversify its tourism source markets and product offerings.
4 There are suggestions that Hong Kong should develop more tourist attractions, introduce effective measures to attract more business visitors and enable further growth of the cruise tourism. Hong Kong has seen very few well-received new tourist spots coming on stream after the opening of the Hong Kong Disneyland in 2005. On business travel, Hong Kong faces keen competition from other Asian cities which have implemented more proactive measures to develop themselves as a business travel destination. As to cruise tourism, Singapore and Shanghai are, geographically speaking, the more preferred home ports for Southeast Asia and Northeast Asia itineraries respectively.
5 For the development of port-of-call business, Hong Kong lacks new tourist attractions and its Kai Tak Cruise Terminal is lagging behind in passenger-friendly transport infrastructure. The subject of tourism falls within the policy areas of the Panel on Economic Development. 2 -20-10010203040Q1Q1Q1Q1Q1Q1 Jan-Jun-20-10010203040Q1Q1Q1Q1Q1Q1 Jan-JunYear-on-year change (%) + first decline since Q3 2009the slowest since Q3 20092009 Year-on-year change (%)Total visitor arrivals 2010 2011 2012 2013 2014 Jan-Jun2015 2009201020112012 2013 2014 Jan-Jun2015 Overnight visitor arrivals (Q3 2009) (Q3 2009)+ (2014) + (2014) (2014)+ (2013) + (2012)+ (2011) + (2010*) Year-on-year change (%) Total visitor arrivals + (2013)+ (2012)+ (2011)+ (2010)Year-on-year change (%)Per capita spending (overnight visitors)+ (2013)+ (2012) + (2011) + (2010)Year-on-year change (%) Per capita spending (same-day visitors)
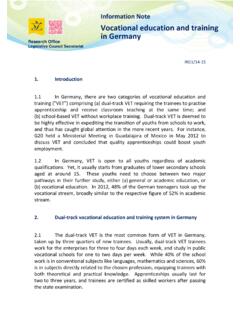
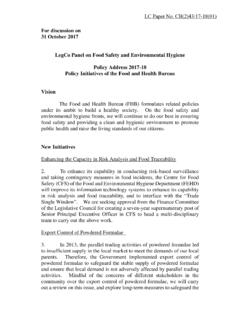
6 Figure 1 Total visitor arrivals and per capita visitor spending, 2010-2014 Note: (*) Total visitor arrivals surged in 2010, consequential to the Central Government's approval in 2009 for residents with eligible Shenzhen household registration to apply for the One-year Multiple-entry Individual Visit Scheme Endorsements to visit Hong Kong. Data source: Hong Kong Tourism Board. Inbound tourism exhibited a visible slowdown in 2015 as total visitor arrivals rose by a mere in the first half of the year (Figure 2). The growth rate was the slowest since the third quarter of 2009 when inbound tourism was hit by the concerns over the spread of human swine flu.
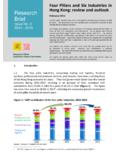
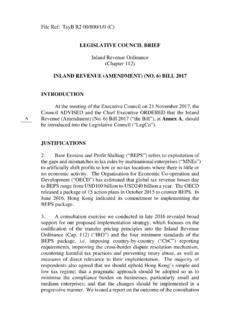
7 Overnight visitor arrivals slackened even more abruptly to decline by , also the first setback since the third quarter of 2009. Figure 2 Visitor arrivals to Hong Kong, 2009 to January-June 2015 Data source: Hong Kong Tourism Board. 3 -30-20-100102030 Jun2014 Jul2014 Aug2014 Sep2014 Oct2014 Nov2014 Dec2014 Jan2015 Feb2015 Mar2015 Apr2015 May2015 Jun2015 Year-on-year change (%) Jewellery, watches and clocks, and valuable gifts Total value of retail sales Amid slower visitor arrivals, the average hotel room occupancy rate retreated from a high of 89% a year earlier to 85% in the first half of 2015. Likewise, the average achieved hotel room rate declined by to HK$1,335.
8 The total value of retail sales also fell by in the first half of 2015, after having declined by four consecutive months since March 2015 (Figure 3). The declining trend was attributable largely to the double-digit decrease in the retail sales value of jewellery, watches and clocks, and valuable gifts, popular shopping items among visitors. Figure 3 Value of retail sales, June 2014 to June 2015 Data source: Census and Statistics Department. 2. Tourist diversion The subdued performance of local inbound tourism indeed mirrored largely the slowdown in the growth of Mainland visitors, as the Mainland has become Hong Kong's largest visitor source market after the launch of the 4 Individual Visit Scheme ("IVS") in 20033.
9 Between 2009 and 2013, Mainland visitors registered an annual average growth of However, in 2014, the growth in Mainland visitors eased to , the slowest since 2009 when the Central Government allowed residents with eligible Shenzhen household registration to apply for One-year Multiple-entry IVS Endorsements to visit Hong Kong. The Mainland market remained weak in 2015 with the growth of Mainland visitors decelerating to in the first half of the year. Among them, the number of higher value-added overnight Mainland visitors even declined by While Hong Kong has seen reduced inflow of overnight Mainland visitors, the number of visits they made to other popular overseas destinations has accelerated in recent months (Figure 4).
10 Relaxed visa requirements (Figure 5) and favourable exchange rates4 (Figure 6) in Japan, Europe and other destinations might have resulted in tourist diversion from Hong Kong. Figure 4 Number of Mainland visitors to selected popular overseas tourist destinations Destination Year-on-year growth* Japan + (Jan-Jun 2015) Thailand + (Jan-May 2015) South Korea + (Jan-Jun 2015) Europe + (Jan-Mar 2015)