Transcription of Residential Lighting End-Use Consumption Study: Estimation ...
1 PNNL-22182 Residential Lighting End-Use Consumption Study: Estimation Framework and Initial Estimates WR Gifford1 ML Goldberg2 PM Tanimoto2 DR Celnicker1 ME Poplawski3 December 2012 Prepared for the Department of energy under Contract DE-AC05-76RL01830 Prepared by DNV KEMA energy and Sustainability Pacific Northwest National Laboratory 1 DNV KEMA energy and Sustainability, Fairfax, Virginia 2 DNV KEMA energy and Sustainability, Madison, Wisconsin 3 Pacific Northwest National Laboratory, Portland.
2 Oregon Executive Summary The DOE Residential Lighting End-Use Consumption Study is an initiative of the Department of energy s (DOE s) Solid-State Lighting Program that aims to improve the understanding of Lighting energy usage in Residential dwellings.
3 The study has developed a regional Estimation framework within a national sample design that allows for the Estimation of lamp usage and energy Consumption 1) nationally and by region of the United States, 2) by certain household characteristics, 3) by location within the home, 4) by certain lamp characteristics, and 5) by certain categorical cross-classifications ( , by dwelling type AND lamp type or fixture type AND control type). The Lighting estimates presented in this report leverage several recent national and regional datasets, linking lamp usage from End-Use metering studies with household characteristics and Lighting inventory profiles that are anchored to a robust regionally stratified national sample design.
4 The Lighting usage measures were estimated using a bottom-up methodology, in that lamp power, hours-of-use (HOU), and energy Consumption estimates were generated at the lamp level and aggregated up to various levels of analysis. It should be noted that the statistical model for lamp usage came from a single regional study that has not yet been calibrated for other regions of the United For many regions, neither a local study nor direct reporting in a national survey was available for use in this analysis, so extrapolations were made based on the information known from neighboring or nearby regions.
5 The available Lighting inventory data available from the South census region were noticeably limited. Lighting inventory data averaged across all regions were assigned to homes in locations without regionally specific data. This study produced Lighting estimates based on existing data. However, the Estimation framework was designed to make straightforward use of new data collected under similar protocols. For example, if a state or regional organization conducted a Lighting study using protocols for the collection of household characteristics, Lighting inventories, and/or the End-Use metering of fixtures that would support linkages of the collected data to the data sources being used in this study, then the new data could be easily incorporated into the developed Estimation framework.
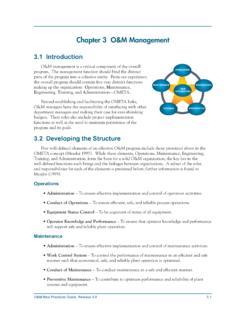
6 Lighting usage estimates could then be updated, resulting in improved regional and possibly national accuracy. The estimates presented in this report include a validation of the accuracy achieved in California using the described process for linking newly collected data. Updates to this study will be considered if enough new data meeting the described pre-conditions and funding for its analysis were to become available. Figure through Figure highlight the variation in estimated regional Lighting usage across the United States.
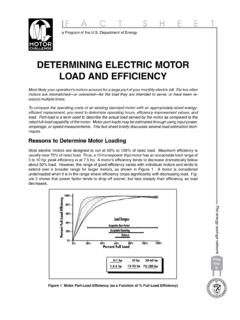
7 Note that states with estimates aggregated from homes without regionally specific Lighting inventory data are highlighted in the figures. The estimated daily usage per lamp averaged hr for all lamps in the United States. Regionally, average estimated daily usage per lamp in households varied between and hr. average estimated HOU per lamp were lowest in Missouri and Virginia (< hr per day) and highest in Massachusetts, New York, Texas, Oklahoma, Arkansas, and Louisiana (> hr per day). 1 Calibrating this Lighting usage model with End-Use data collected in other regions will be the primary objective of potential future updates to the DOE Residential Lighting End-Use Consumption Study.
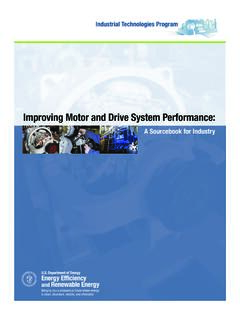
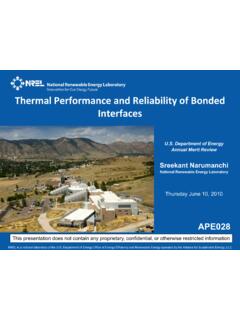
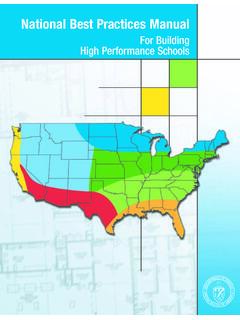
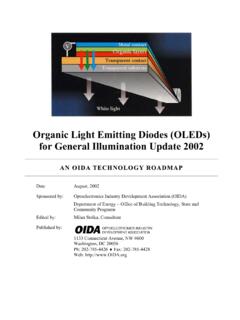
8 Iii * Note: Lighting inventory data for this state or its neighbor was not available. Figure Regional Variation in average Daily HOU per Lamp * Note: Lighting inventory data for this state or its neighbor was not available. Figure Regional Variation in average Lamp Power (W) iv * Note: Lighting inventory data for this state or its neighbor was not available. Figure Regional Variation in average Number of Lamps per Household * Note: Lighting inventory data for this state or its neighbor was not available.
9 Figure Regional Variation in average Annual Lighting energy Usage per Household v The average lamp power in a region is largely driven by the household preference for compact fluorescent versus incandescent lamps.
10 The United States, as a whole, averaged watts (W) per lamp. Figure shows a clear regional association with average lamp power, with the Midwest showing the highest and the Northeast the lowest average . Several states in the Northeast averaged less than 43 W per lamp, led by New York with W per lamp. Illinois had the highest average , at W per lamp, followed by several other Midwestern states averaging at least 53 W per lamp. Note that the lamp power assigned to many states in the South census region is simply the average , given the lack of available Lighting inventory data for any of the states in this region.