Transcription of Risk assessment: workers operating in loading/unloading ...
1 Risk assessment: workers operating in loading/unloading (shipping/receiving) areas E. Salvador & M. Forte Axa Matrix Risk Consultants, Italy Abstract loading/unloading areas are essential for many businesses, including production facilities, logistic centres, product receiving/shipping centres, department stores etc. These areas can be very dangerous for workers due to the type of operation, the use of mobile equipment and the frequent interferences between workers and mobile equipment. This presentation is a quantitative methodology (isorisk maps) to analyse and map the risks related to loading/unloading areas with the aim of comparing the various levels of exposure for workers , considering different technical and design solutions and with respect to applicable procedures. This methodology is based on the identification of a risk assessment criteria (risk grading) from which it is possible to extract quantitative indications of the vulnerability level (probability), severity (loss potential) for each site and the impact of single risk factors.
2 Keywords: risk assessment, vulnerability, severity, loading/unloading areas, shipping/receiving areas, i sorisk maps. 1 Isorisk maps As already described in Forte and Salvador [1] this methodology for identifying and representing the risk is based on the evaluation of vulnerability and severity for each identified scenario. Vulnerability is defined as a measure of the frequency and probability in normal operative conditions. Severity is defined as the quantification of loss expectancy in normal operative conditions with prevention and protection systems. Using these criteria, it is possible to produce graphs vulnerability severity (so-called isorisk maps ), to graphically represent the exposure to a given peril. Safety and Security Engineering V 55 , ISSN 1743-3509 (on-line) WIT Transactions on The Built Environment, Vol 134, 2013 WIT graph refers to the traditional risk definition: VSR =, where S is the severity, V the vulnerability and R the risk.
3 As it is not possible to define a mathematical value of the frequency, an alternative value, defined as vulnerability , is used. This vulnerability is based on the evaluation and subsequent elaboration of some typical indicators of the event frequency. In the graph, each location (a production facility, a warehouse or any other type of facility) is represented with a dot whose position is defined by the vulnerability and severity values (defined in the following paragraphs). Figure 1 is an example. This methodology will be applied to assess the risk for operators working in loading/unloading areas. Figure 1: Isorisk map. 2 loading/unloading docking bays This paper refers to loading docks in which the connection between the floor and the truck is made through electro-hydraulic ramps. This connection must be correctly positioned to guarantee stability during the passage of mobile equipment or operators used to load or unload the truck.
4 Typically, loading docks are at least m high and are as long as needed to cover the front of the service area to protect equipment operations from weather (as shown in Figure 2). 56 Safety and Security Engineering V , ISSN 1743-3509 (on-line) WIT Transactions on The Built Environment, Vol 134, 2013 WIT Press Figure 2: loading/unloading docks. Loading ramps and docking bays have specific characteristics and are referenced in the Health and Safety rules in work areas (see ref). erences These work areas are often identified as the most dangerous in many Risk Assessment documents, and are therefore subject to particular attention by Prevention and Protection Officers. Evaluations are usually based on qualitative or semi-quantitative criteria, using a risk matrix where higher values correspond to higher risks. However, an in-depth analysis of the areas is usually lacking, thus preventing the identification of the main risk factors on which to intervene with adequate prevention and protection measures.
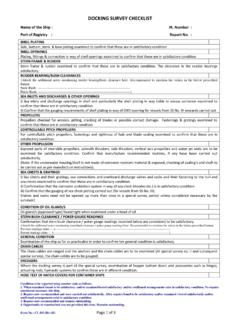
5 Assuming typical work rules are respected, the following methodology provides a tool to compare different physical and human arrangements to assess the aspects most affecting a loading/unloading area risk. 3 Methodology to develop a grading system for quantifying the risk The creation of an evaluation system (grading) of the risk in loading/unloading areas (ref. Figure 3) is based on a series of activities, summarised as follows: - Breakdown of loading and unloading area into macroareas - Analysis of the main risks present in the macroareas - Engineered analysis of the macroareas and definition of a set of variables - Definition of algorithms for risk quantification This grading is based on the definition of a set of variables, each one associated with two or more closed answers corresponding to ratings used by algorithms for risk quantification. This data input structure allows the distribution of the grading via a checklist sent to various locations.
6 Collected information is then converted into numerical indications through a system of weights and algorithms, guaranteeing the objectiveness of the analysis. Safety and Security Engineering V 57 , ISSN 1743-3509 (on-line) WIT Transactions on The Built Environment, Vol 134, 2013 WIT Press Figure 3: Analysis methodology. Breakdown of loading/unloading areas into macroareas The analysis of areas used for product loading/unloading operations through docking bays equipped with motorized ramps identifies six possible macroareas, each with features allowing the development and the creation of a set of dedicated variables. The identified macroareas can be further subdivided into physical areas (physical aspects) and human element aspects, as shown in Figure 4. 58 Safety and Security Engineering V , ISSN 1743-3509 (on-line) WIT Transactions on The Built Environment, Vol 134, 2013 WIT Press Figure 4: Breakdown into macroareas.
7 Physical elements 1. Service area area in the front of the docking bay, dedicated to trucks moving 2. docking Bay area raised with respect to the service area, dedicated to the ramp and docking facilities and to the mobile or manual means to manoeuvre goods from the truck. 3. Ramp hooked or telescopic, used to connect the docking bay and the truck 4. Truck truck must approach the docking bay and be docked for loading/unloading operations. Human Element aspects 5. Bay operator responsible for loading and unloading operations from the truck. 6. Truck operator truck driver (employee of the Customer or third company). Each area has been analysed to highlight the variables and the perils affecting the associated risk. Main perils present in the macroareas Considering the identified macroareas and the kinds of activities present, the majority of perils can be linked to: - Fall Falls are possible from the bay (usually placed at 1,5-2 m higher with respect to the service area) due to an early departure of the truck or to inadequate anti-fall protection means on the docking bay.
8 - Trip/Slippage Trip peril can be due to the presence of protrusions on the floor (ex. the ramp is lifted from the bay, or presence of truck guiding tracks in the service Safety and Security Engineering V 59 , ISSN 1743-3509 (on-line) WIT Transactions on The Built Environment, Vol 134, 2013 WIT Pressarea); slippage can be due to slippery surfaces (ex. for macroclimatic aspects not adequately managed). - Accident In the service and docking areas, due to the presence of vehicles and operators in movement. - Crush/hit Crushing of a worker by a moving vehicle against a wall or pallet load, or a hit between the vehicle and a worker operating in the service or docking areas. Analysis of the areas and creation of a set of variables The analysis then further defines a wide number of variables linked to the various macroareas. As per the example in Figure 5 below, these variables are defined for the macroarea: Service Area.
9 A weight is then attributed to each variable, based on a predetermined criteria for each of the perils it is connected to. Figure 5: Details of variables for the service area. The analysis process, then weights each variable as a function of each connected peril, and the effect in terms of vulnerability and/or severity. This is outlined in the following table, showing the analysis done for the presence of lateral demarcation lines of trucks in the service area. 4 Risk quantification To allow a self-assessment, a set of closed answers is assigned to each question. The answers are then modified by an algorithm which associates them to a rating. Together with the previously described weights, this quantifies the contribution of a single element to the vulnerability and severity. 60 Safety and Security Engineering V , ISSN 1743-3509 (on-line) WIT Transactions on The Built Environment, Vol 134, 2013 WIT PressTable 1: Example of a checklist, relative to variable of Figure 4.
10 Area: 1. Service area Variable: Truck lateral demarcation lines Type of variable (vulnerability/severity): V This element affects only the vulnerability, as it does not represent a physical obstacle to the occurrence of a loss, but it can decrease its probability. Weights: Fall 0 Not applicable in the service area as there is no height difference: null. Stumble/Slippage 0 The presence/lack of lateral demarcation lines does not affect the possibility of tripping/slippage of the workers : null Accident W3 The presence of demarcation lines in the service area helps the drivers while approaching the truck to the docking bay, decreasing the possibility (vulnerability) of an accident/hit of the workers : weight not null, to be defined according to the quantification criteria adopted. Crush/Hit W4 To obtain risk indicators useful to compare the areas between the various locations, these ratings are elaborated to obtain, respectively: - Vulnerability Vp and severity Sp associated to each peril, irrespective of the area; - Vulnerability Va and severity Sa associated to each area, irrespective of the peril; - Global vulnerability Vg and severity Sg associated with the loading/unloading area of the location, considering the contributions of all the variables in each area and associated with each peril.