Transcription of Risk Management Series - Part 6: Estimating Probability of ...
1 Risk Management Page 1 of 9 August 2011 Part 6: Probability of occurrence of Harm Risk Management Series - Part 6: Estimating Probability of occurrence Foreword MEDI cept presents this ongoing Series of articles focused on the implementation and practical conduct of risk Management in the medical device industry to provide practitioners with insight into how to apply risk Management principles and tools to improve the performance and safety of their devices; and, as an added benefit, to maintain compliance with risk Management standards. Our team at MEDI cept publishes these articles to capture best practices, to explore the more challenging aspects of maintaining risk Management systems over the long term, and to elicit discussions among practitioners. To this last point, if you have questions or comments on the issues discussed, or if you have recommendations for topics to consider in the future, please let us know: 508-231-8842.
2 In our last article, Part 5: Assessing Severity, we addressed the importance of doing your homework before attempting to assess the severity of identified hazards/harms, clearly defining the use environment and user profile being considered, and distinguishing between harms that occur as a direct result of the hazard/hazardous situation and harms that will only occur as the result of a Series of subsequent events. This article addresses the other major element of risk, the Probability of occurrence of Harm. If you ve missed any of the previous articles look them up on The Elements of the Probability of occurrence of Harm Risk is composed of two elements: Severity and the Probability of occurrence of Harm. Unlike the assessment of Severity, which is typically based on qualitative criteria used to describe the harm caused to people, property or the environment; the estimation of the Probability of occurrence of Harm is typically based on quantitative criteria ( , hard numbers derived from field experience and engineering studies) but that doesn t mean it s any easier.
3 First, there are a few things that you need to keep in mind: A failure is not necessarily a hazard: The failure of a device is only a hazard if it can cause harm to people, property or the environment through a foreseeable sequence of events. There are few medical device failures that could not conceivably result in harm even a device that fails in a safe condition could result in a delay of treatment but the failure vs. hazard distinction is important to keep in mind. Risk Management Page 2 of 9 August 2011 Part 6: Probability of occurrence of Harm If there is no exposure to a hazard, there can be no harm1: ISO 14971 states that a hazard cannot result in harm until such time as a sequence of events or other circumstances (including normal use) lead to a hazardous situation (Section ). So exposure is a key element in the estimation of risk more on this later. Estimating Probability of occurrence of Harm requires a clearly defined harm: In most cases, a hazard can be associated with a range of harms ( , a cut could lead to infection, and then illness, permanent damage to the limb, and then, possibly, death).
4 In our previous article, Assessing Severity, we describe an approach for determining the harm (and associated Severity score) that is most appropriate for a particular hazard. If there are multiple, potential harms, there is likely a different Probability of occurrence for each of those harms. Typically, harms that occur only as the result of a long sequence of events are less likely to occur than harms that are an immediate result of a device failure. You will need to clearly define the harm that is the subject of your analysis (and the sequence of events leading to that harm) to effectively estimate the Probability of occurrence of Harm. The Probability of occurrence of Harm estimate needs to be per use : Too often we come across risk analyses where the Probability of occurrence units are unstated or ambiguous. The only practical way to characterize these estimates is on a per use basis.
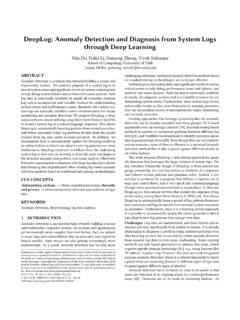
5 For single-use devices, it s pretty simple: the Probability states that the harm is likely to occur once for every 1,000; 10,000; 1,000,000, etc. uses of the device. For reusable devices, you ll need to make some assumptions about the expected life of the device ( , 5 years) and the number of uses over that lifetime ( , 250 uses per year leading to 1,250 uses over the life of the device). If your device has both reusable and disposable components, you ll need to be sure that your criteria are appropriate for both. The full benefit of making per use estimates becomes clear once you start collecting complaint data. With risk and complaint data described in the same terms, you ll be in a much better position to identify when gaps exist between expectations and reality. The standard (ISO 14971:2007) brings all of the elements of risk together in one graphic in Annex E (see Figure 1). In addition to Severity of the Harm and Probability of occurrence of Harm , this graphic introduces two new terms: The Probability of a hazardous situation occurring (P1); and The Probability of a hazardous situation leading to harm (P2).
6 The product of those two terms is the Probability of occurrence of Harm. 1 ISO 14971:2007, Section Probability estimation. Risk Management Page 3 of 9 August 2011 Part 6: Probability of occurrence of Harm Figure 1: Components of Risk (From ISO 14971:2007 Figure ) The consideration of both terms is a key element of the standard, but it is overlooked by many device manufacturers. That s not too surprising - the standard doesn t provide much guidance on how to work with these two terms. At first, it seems pretty straight-forward .. for example, if there s a hot surface on a device (the hazardous situation P1), it will only cause a burn (the harm) when the user comes into contact with that surface (the hazardous situation leading to harm P2). If the surface is always hot when the device is in use (P1 = ) and the user comes into contact with that surface once every ten uses (P1 = ), the Probability of occurrence of Harm would be - , once out of every ten uses ( x = ).
7 Most manufacturers do not explicitly estimate both P1 and P2 and report only a single Probability of occurrence score in their FMEAs. The two terms (P1 and P2) are implicit in this single score. The problem is that the single score doesn t provide you with much information. Does a Moderate score mean that that there is a moderate chance that the hazardous situation (the hot surface) will occur and a moderate chance that it will lead to harm? Or does it mean that there a high chance of occurrence , Risk Management Page 4 of 9 August 2011 Part 6: Probability of occurrence of Harm but only a slight chance that it will result in harm - leading to an overall Moderate Probability of harm? There no way to tell. Does that matter? .. Maybe. It may affect how you decide to mitigate the risk. If the surface is always hot, a design change to reduce the temperature or place a guard over the surface may be the best approach.
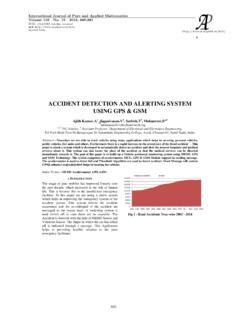
8 If the surface gets hot only once every ten uses, an alarm to warn the user may be appropriate. (Note: the alarm wouldn t make sense in the first scenario because it would be alarming all the time.) Knowing the difference between P1 and P2 is also helpful when you reassess the risk following mitigation. If the mitigation reduces the Probability that the hazardous situation occurs (P1), it may have a different overall impact than if it reduces the potential for the hazardous situation to cause harm (P2). To better illustrate how these two factors are defined, let s look at an example based on Table in ISO 14971. Figure 2 breaks one of the five examples from Table into its specific elements. In this example, an electrostatic discharge (ESD) causes an infusion pump to fail, in turn causing harm to a diabetic patient. Four separate, potential harms are identified in the example. The one element included in our figure, but missing from the original table, is Detection Failure.
9 We ve added that element because it seems reasonable to consider the potential for the patient to realize that he/she is not receiving treatment. Risk Management Page 5 of 9 August 2011 Part 6: Probability of occurrence of Harm Figure 2: Probability of occurrence of Harm Example (based on ISO 14971:2007 Table ) Working from left to right, you can see that P1, Hazardous Situation Occurs, is based on the Probability of the occurrence of a sequence of three foreseeable events. Working down through the diagram, you can see that P2, Hazardous Situation Leads to Harm, is based on the Probability that the user does not detect the failure and the hazardous situation leads to a particular harm. The overall Probability of occurrence of Harm is the product of the terms P1 and P2. As described above and in our previous article, Assessing Severity, the FMEA approach to risk analysis requires that you clearly identify the harm to be considered in the analysis.
10 As shown in Figure 2, there are four potential values for the Probability of occurrence of Harm in this example. They are illustrated here as A, B, C or D. While P1 is the same in each case, P2 will vary based on the Probability the hazardous situation leads to the particular harm. Risk Management Page 6 of 9 August 2011 Part 6: Probability of occurrence of Harm Clearly, your decision regarding which harm to consider drives both the assessment of Severity and the estimate for the Probability of occurrence of Harm. As illustrated in Figure 2, while Decreased Consciousness may be a relatively low severity harm, it is more likely to occur than the other potential harms. Death , on the other hand, is a catastrophic harm, but it s less likely to occur. Is there some way to account for the full range of potential harms and associated probabilities of occurrence ? Yes, but that approach creates other problems (maybe we ll get into that in a future article).