Transcription of Risk ParityTM and Inflation - PanAgora
1 Risk parity and Inflation protectionRisk parity portfolios balance risk contribution from high- risk assets, such as equities and commodities, and low-risk assets, such as investment-grade bonds. To achieve true diversification without comprising the return/risk target, it is often necessary to have higher exposures to lower-risk assets, resulting in leverage at the portfolio level. As a result, when compared to traditional asset allocation approaches, Risk parity portfolios tend to have a larger exposure to fixed income because investment-grade bonds have relatively lower return volatility. With bond yields near the lower end of their historical range, one natural concern about a Risk parity portfolio is its exposure to a leveraged bond position.
2 This concern becomes particularly worrisome if the economy enters a period of rising Inflation . In spite of an unprecedented amount of monetary and fiscal accommodation, we believe that the current economic environment of high unemployment, low capacity utilization, and declining credit demand make hyperinflationary pressures unlikely for the foreseeable future. Regardless, higher Inflation is certainly possible in the long run. As a result, it is prudent to study the investment consequence of a higher Inflation scenario on asset allocation decisions in general and a Risk parity approach in particular. It is well understood that rising Inflation hurts expected returns for nominal bonds as it leads to higher nominal interest rates.
3 What is less appreciated, but equally important, is that rising Inflation will not be kind to equity investments either. In theory, equity should provide infla-tion hedging since equity investors have a claim to real company earnings. In practice, however, this has not been the case, which is clearly demonstrated by comparing asset class returns from the 1970 s. If a traditional approach toward asset allocation with an unbalanced risk allocation to equities is not the best defense for an environment of rising Inflation , what approach should investors adopt? In our view, the answer is unequivocally the Risk parity traditional allocation, there are two aspects of a Risk parity portfolio that aim to defend against Inflation risk and generate real rates of return that are lacking in traditional asset allocation.
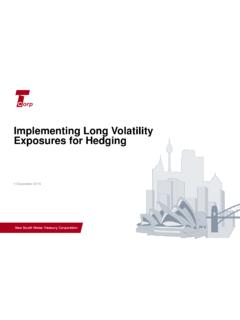
4 The first line of defense is through exposure to commodities and TIPS. The target baseline risk allocation to these two asset classes is 20%, which amounts to a significant notional exposure of 40% on average. The second is PanAgora s proprietary dynamic risk allocation process. Our research has shown that dynamic risk allocation is highly responsive to infla-tion cycles and provides an additional source of Inflation hedging as it becomes analysisTo further study the issue, we turn to a historical perspective by examining Risk parity portfolios in the high Inflation period of the 1970 s. Exhibit 1 shows annual CPI in the from 1970 to 2009.
5 The 1970 s are characterized by generally higher Inflation that averaged per year. In addition to elevated Inflation on average, the 1970 s also experienced two separate oil shocks causing Inflation spikes above 10%. The following three decades saw much lower Inflation : annualized CPI averaged from 1980 to 1989, from 1990 to 1999, and from 2000 to Qian, , CFAC hief Investment Officer and Head of Research, Macro StrategiesPanAgora Asset ManagementA p r i l 2 0 1 0 Risk ParityTM and InflationExHibit 1: AnnuAl PERcEntAgE c HAngE of cPi1/701/721/741/781/801/821/841/861/881 /901/921/941/961/981/001/021/041/061/081 /10-4%-2%0%2%4%6%8%10%12%14%16% Source: 1970 s lends itself to be an ideal stress-testing environ-ment for the Risk parity approach to asset allocation.
6 In addition to elevated Inflation , the 1970 s also experienced a massive increase in the level of interest rates. During the decade, the federal funds rate was increased by 1200 basis points (from to ) and 10-year yields increased by 400 basis points (from to ). In the face of these extreme conditions, would Risk parity be able to pass the test? To answer the question, we simulate its perfor-mance using four asset classes: equity (S&P 500), nominal bonds (5-year Treasury bonds), commodi-ties (GSCI), and TIPS. The selection of these four was based on data availability and their relevance to Risk parity TIPS are an integral component of a Risk parity portfolio, particularly during periods of rising Inflation .
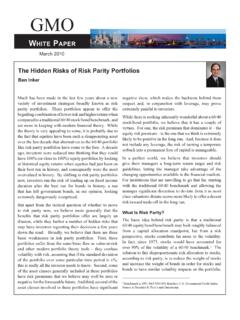
7 The challenge with evaluating TIPS in historical studies is that the government only started issuing TIPS in 1997. For the purposes of this study, we overcome this data limitation by simulating TIPS returns using prevailing real yields, derived from nominal bond yields and long-term Inflation . Exhibit 2 shows four decades of annualized returns for various asset classes as well as for CPI. One of the asset classes included in Exhibit 2 is cash. Cash returns are impor-tant since Risk parity portfolios partly depend on excess returns of risk assets over cash. In the 1970 s when infla-tion was high and volatile, cash, nominal bonds, and stocks had positive returns but they all underperformed CPI, resulting in negative real returns.
8 GSCI was by far the best-performing asset while TIPS also returned 3% higher than CPI. The fortunes reversed in the following two decades. With declining Inflation came booming stock markets and sizable nominal bond returns while the return of real assets declined. Despite relative underperformance, both GSCI and TIPS still delivered positive real returns in the 1980 s and 1990 s. Disinflation continued in the most recent decade. GSCI, TIPS,2 and nominal bonds all delivered low, single-digit returns but were able to outperform cash and CPI. In contrast, stock markets had negative returns for the past 10 years with the bursting of the tech and credit 2: AnnuAlizEd PERcEntAgE c HAngE in cPi And AnnuAlizEd REtuRnS of finAnciAl ASSEtSCpiCashGSCiTip BondsS&p 5001970 Source: simulate Risk parity portfolio returns based on four assets (five, including cash), according to the same investment process we follow in practice.
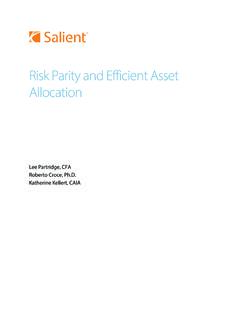
9 We assign risk allocation targets to each asset class and estimate a covariance matrix. Next, we find the portfolio that matches the risk allocation targets and total portfolio risk for the next period. In addition, we simulated two versions of Risk parity : Risk parity Foundation, with fixed risk targets, and Risk parity Dynamic, with dynamic risk allocation targets based on our proprietary dynamic risk allocation process. For comparison, we also show returns of a traditional 60/40 stock/bond portfolio using the same asset class 1 The Risk parity portfolio invests in nine asset classes: large-cap equity, small-cap equity, international equity, emerging-market equity, Treasury bonds, international government bonds, corporate bonds, TIPS, and commodities.
10 2 TIPS returns are simulated for the period 1970 1996. Assumptions and calculation methodology available upon request. 3 The 60/40 portfolio represents a blend of 60% MSCI World Index and 40% Citigroup World Government Bond Index 3: SimulAtEd AnnuAlizEd REtuRnS foR RiSk parity PoRtfolioS And 60/40 PoRtfolio (gRoSS of fEES)risk parity Foundationrisk parity Dynamic60/40 Cpi1970 The hypothetical performance information presented is supplemental to the GIPS-compliant presentation for the Risk parity strategy included as part of these materials. Past performance is not a guarantee of future results. Source: 3 shows the returns of the Risk parity Foundation, Risk parity Dynamic, and 60/40 portfolios for the past four decades.