Transcription of rworldmap: A New R package for Mapping Global Data
1 CONTRIBUTEDRESEARCHARTICLES35rworldmap: A New R package forMapping Global Databy Andy SouthAbstractrworldmapis a relatively new pack-age available on CRAN for the Mapping and vi-sualisation of Global data. The vision is to makethe display of Global data easier, to facilitate un-derstanding and communication. The initial fo-cus is on data referenced by country or grid dueto the frequency of use of such data in Global as-sessments. Tools to link data referenced by coun-try (either name or code) to a map, and then todisplay the map are provided as are functions tomap Global gridded data. Country and griddedfunctions accept the same arguments to specifythe nature of categories and colour and how leg-ends are formatted. This package builds on thefunctionality of existing packages , particularlysp,maptoolsandfields. Example code is pro-vided to produce maps, to link with the pack-agesclassInt,RColorBrewerandncdf, and toplot examples of publicly available country andgridded datasets are becoming increasingly commonand are frequently seen on the web, in journal pa-pers and in our newspapers (for example a carbonatlas of Global emissions available ).
2 At the same timethere is a greater interest in Global issues such as cli-mate change, the Global economy, and poverty (asfor example outlined in the Millenium DevelopmentGoals, ). Thirdly, there is an increasing availability ofsoftware tools for visualising data in new and inter-esting ways. Gapminder ( ) has pioneered making UN statistics more avail-able and intelligible using innovative visualisationtools and Many Eyes ( )provides a very impressive interface for sharing dataand creating maps have become so common that theyhave even attracted Onion s Atlas ofthe Planet Earth (The Onion, 2007), contains a BonoAwareness world map representing the intensitywith which artist Bono is aware of the plight anddaily struggles of region , with a categorisation rang-ing from has heard of nation once through movedenough by nations crisis to momentarily remove sun-glasses to cares about welfare of nation nearly asmuch as his own.
3 There appears to be a gap in the market forfree software tools that can be used across disci-plinary boundaries to produce innovative, publica-tion quality Global visualisations. Within R there aregreat building blocks (particularlysp,maptoolsandfields) for spatial data but users previously had to gothrough a number of steps if they wanted to produceworld maps of their own data. Experience has shownthat difficulties with linking data and creating classi-fications, colour schemes and legends, currently con-strains researchers ability to view and display globaldata. We aim to reduce that constraint to allow re-searchers to spend more time on the more importantissue of what they want to display. The vision forrworldmapis to produce a package to facilitate thevisualisation and Mapping of Global data. Becausethe focus is on Global data, the package can be morespecialised than existing packages , making worldmapping easier, partly because it doesn t have to dealwith detailed local maps.
4 Throughrworldmapweaim to make it easy for R users to explore their globaldata and also to produce publication quality figuresfrom their partly inspired and largelyfunded by the UK Natural Environment ResearchCouncil (NERC) program Quantifying Uncertaintyin Earth System Science (QUEST). This programbrings together scientists from a wide range of dis-ciplines including climate modellers, hydrologistsand social was apparent that whileresearchers have common tools for visualisationwithin disciplines, they tend to use different onesacross disciplines and that this limits the sharingof data and methods necessary for truly interdis-ciplinary research. Within the project, climate andearth system modellers tended to use IDL, ecologistsArcGIS, hydrologists and social scientists Matlab andfisheries scientists R. With the exception of R, thesesoftware products cost thousands of pounds whichacts as a considerable constraint on users being ableto try out techniques used by collaborators.
5 Thishigh cost and learning curve of adopting new soft-ware tools hinders the sharing of data and methodsbetween disciplines. To address this, part of the vi-sion forrworldmapwas to develop a tool that can befreely used and modified across a multi-disciplinaryproject, to facilitate the sharing of scripts, data andoutputs. Such freely available software offers greateropportunity for collaboration with research institutesin developing countries that may not be able to af-ford expensive R Journal Vol. 3/1, June 2011 ISSN 2073-485936 CONTRIBUTEDRESEARCHARTICLES rworldmap data inputsrworldmapconsists of tools to visualise Global dataand focuses on two types of data. Firstly, data thatare referenced by country codes or names and sec-ondly, data that are referenced on a dataThere is a wealth of Global country level data avail-able on the internet including UN population data,and many Global indices for, among others: Envi-ronmental Performance, Global Hunger and Multi-dimensional are commonly referenced by country namesas these are the most easily recognised by users,but country names have the problem that vocabu-laries are not well conserved and many countrieshave a number of subtly different alternate names( Ivory Coast and Cote d Ivoire, Laos and Peo-ple s Democratic Republic of Lao).
6 To address thisproblem there are ISO standard country codes of ei-ther 2 letters, 3 letters or numeric, and also 2 letterFIPS country codes, so there is still not one univer-sally adopted all ofthese country codes and offers tools to help whendata are referenced by names or other dataGlobal datasets are frequently spatially referencedon a grid, because such gridded or raster data for-mats offer advantages in efficiency of data storageand processing. Remotely sensed data and other val-ues calculated from it are most frequently availablein gridded formats. These can include terrestrial ormarine data or are many gridded data formats, here I willconcentrate on two: ESRI GridAscii and GridAscii files are an efficient way of storingand transferring gridded data. They are straightfor-ward text files so can be opened by any text have a short header defining the structure ofthe file ( number, size and position of rows andcolumns), followed by a single row specifying thevalue at each grid cell.
7 Thus they use much less spacethan if the coordinates for each cell had to be start of gridAscii file for a half degreeglobal grid:ncols 720nrows 360xllcorner -180yllcorner -90cellsize -999-999 1 0 1 1 .. [all 259200 cell values]NetCDF is a data storage file format com-monly used by climate scientists and oceanogra-phers. NetCDF files can be multi-dimensional, (x,y)data for multiple attributes over mul-tiple months, years, days etc. The packagencdfisgood for reading data from netCDF functionalityrworldmaphas three core functions outlined belowand others that are described ()joins user countrydata referenced by country names or codes toa map to enable ()plots a map of country ()plots a map of gridded dataJoining country data to a mapTo join the data to a map will need to specify the name of column contain-ing your country identifiers (nameJoinColumn) andthe type of code used (joinCode) "ISO3" for ISO3 letter codes or "UN" for numeric country (countryExData)sPDF <- joinCountryData2 Map( countryExData,joinCode = "ISO3",nameJoinColumn = "ISO3V10")This code outputs, to the R console, a summary ofhow many countries are successfully joined.
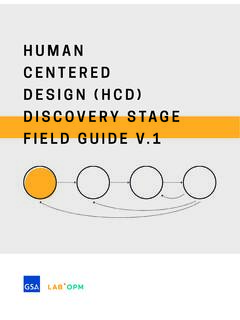
8 You canspecifyverbose=TRUEto get a full list of object returned (named sPDF in this case) is oftype"SpatialPolygonsDataFrame"from the packagesp. This object is required for the next step, display-ing the you only have country names rather than codesin your data, usejoinCode="NAME"; you can expectmore mismatches due to the greater variation withincountry names mentioned previously. To addressthis you can use theidentifyCountries()functiondescribed below, and change any country names inyour data that do not exactly match those in the in-ternal country dataTo plot anything other than the default map,mapCountryDatarequiresanobjectofclas s"SpatialPolygonsDataFrame"and a specification ofthe name of the column containing the data to plot:data(countryExData)sPDF <- joinCountryData2 Map( countryExData,joinCode = "ISO3",nameJoinColumn = "ISO3V10")mapDevice() #create world map shaped windowmapCountryData(sPDF,nameColumnToPl ot='BIODIVERSITY')The R Journal Vol.
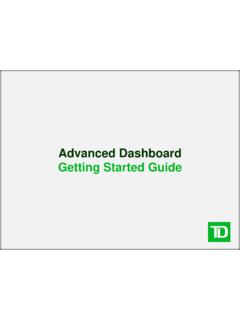
9 3/1, June 2011 ISSN 1: Output of mapCountryData() Mapping gridded dataThemapGriddedDatafunction can accept either1. an object of type"SpatialGridDataFrame", asdefined in the packagesp2. the name of an ESRI GridAscii file as a charac-ter string3. a 2D R matrix or array (rows by columns)rworldmapcontains a"SpatialGridDataFrame"example that can be accessed and mapped as shownin the code and figure (gridExData)mapDevice() #create world map shaped windowmapGriddedData(gridExData)02735000 0 Figure 2: Output of mapGriddedData()Modifying map appearancerworldmapplotting functions are set up to workwith few parameters specified (usually just thoseidentifying the data) and in such cases, default val-ues will be used. However, there is considerable flex-ibility to modify the appearance of plots by specify-ing values for arguments. Details of argument op-tions are provided in the help files but here are a se-lection of the main arguments: catMethoddetermines how the data valuesare put into categories (thencolourPalettedeterminesthecoloursfo rthosecate-gories).
10 Options forcatMethodare:"pretty","fixedWidth","d iverging","logfixedWidth","quantiles","c ategorical", or a numeric vec-tor defining the breaks between with the next argument (numCats) , al-thoughnumCatsis not used for"categorical",where the data are not modified, or if the userspecifies a numeric vector, where the numberof categories will be a result. numCatsspecifies the favoured number of cat-egories for the data. The number of categoriesused may be different if the number requestedis not possible for the chosencatMethod( "quantiles"if there are only 2 values in thedata it is not possible to have more than 2 cate-gories). colourPalettespecifies a colour palette to usefrom:1."palette"for the current palette2. a vector of valid colours, ("red","white", "blue")oroutputfromRColorBrewer3. astringdefiningoneofthein-ternalrworldma ppalettesfrom:"heat","diverging","white2 Black","black2 White","topo","rainbow","terrain","negpo s8","negpos9".