Transcription of S&P 500 Sectors & Industries Profit Margins
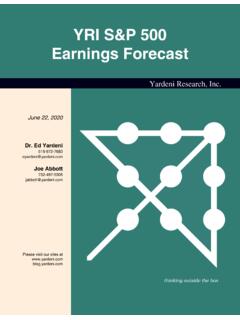
1 S&P 500 Sectors & IndustriesProfit Margins (quarterly)Yardeni Research, 5, 2022Dr. Edward visit our sites outside the boxTable Of ContentsTable Of ContentsTable Of ContentsMarch 5, 2022 / S&P 500 Sectors & Industries Profit Margins Research, 500 Operating Profit MarginsS&P 500 Profit Margin3-6S&P 500 Sectors Forecasted & Actual Profit Margins7-8 Communication Services5-6 Consumer Discretionary7-8 Consumer Staples9 Energy10 Health Care11 Industrials12 Information Technology13 Materials1494 95 96 97 98 99 00 01 02 03 04 05 06 07 08 09 10 11 12 13 14 15 16 17 18 19 20 21 22 23 24-12-10-8-6-4-20246810121416-12-10-8-6- 4-20246810121416Q4S&P 500 Profit margin (percent, quarterly)
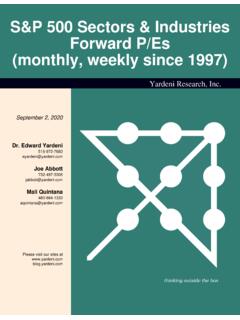
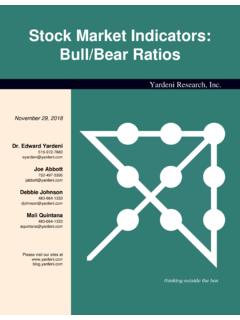
2 500 Profit MarginOperating* ( )Reported** ( )* S&P 500 operating earnings per share (I/B/E/S data) divided by S&P 500 revenues per share.** S&P 500 reported earnings divided by S&P 500 revenues per : Standard & Poor s Corporation and I/B/E/S data by 95 96 97 98 99 00 01 02 03 04 05 06 07 08 09 10 11 12 13 14 15 16 17 18 19 20 21 22 23 500 Profit margin (percent, trailing four-quarter average)Operating ( )Reported ( )Source: Standard & Poor s (revenues and reported EPS) and I/B/E/S data by Refinitiv (operating EPS). 500 Profit MarginPage 3 / March 5, 2022 / S&P 500 Sectors & Industries Profit Margins Research, 95 96 97 98 99 00 01 02 03 04 05 06 07 08 09 10 11 12 13 14 15 16 17 18 19 20 21 22 23 500 OPERATING Profit margin (percent)Quarterly ( )Trailing four-quarteraverage ( )Source: Standard & Poor s Corporation (revenues) and I/B/E/S data by Refinitiv (operating EPS).
3 93 94 95 96 97 98 99 00 01 02 03 04 05 06 07 08 09 10 11 12 13 14 15 16 17 18 19 20 21 22 23 500 REPORTED Profit margin (percent)Quarterly ( )Trailing four-quarteraverage ( )Source: Standard & Poor s 500 Profit MarginPage 4 / March 5, 2022 / S&P 500 Sectors & Industries Profit Margins Research, 2005 2006 2007 2008 2009 2010 2011 2012 2013 2014 2015 2016 2017 2018 2019 2020 2021 2022 2023 2024678910111213146789101112131423222/24 2 (percent, dividing forward earnings by forward revenues)* Time-weighted average of the consensus estimates for current year and next year.
4 Monthly through December 2005, then : I/B/E/S data by 500 Profit MARGINC onsensus Forecasts52-week forward* ( )AnnualFigure 500 Profit margin MEASURES(percent)S&P 500 Operating Profit MarginsForward*Actual (trailing 4Q average)Source: I/B/E/S data by Refinitiv and Standard & Poor * Forward earnings divided by forward 500 Profit MarginPage 5 / March 5, 2022 / S&P 500 Sectors & Industries Profit Margins Research, 94 95 96 97 98 99 00 01 02 03 04 05 06 07 08 09 10 11 12 13 14 15 16 17 18 19 20 21 22 23 2425075012501750225027503250375042504750 52504567891011121314Q43 500 & Profit Margins &P 500 index ( )Operating trailing4-quarter Profit margin ( ) Source.
5 Standard & Poor s Corporation and I/B/E/S data by 2005 2006 2007 2008 2009 2010 2011 2012 2013 2014 2015 2016 2017 2018 2019 2020 2021 2022 2023 2024500100015002000250030003500400045005 0005500678910111213142/243 500 & FORWARD Profit Margins &P 500 index ( )Forward Profit margin ( ) * Time-weighted average of the consensus estimates for current and next year. Monthly through December 2005, weekly : Standard & Poor s Corporation and I/B/E/S data by 500 Profit MarginPage 6 / March 5, 2022 / S&P 500 Sectors & Industries Profit Margins Research, 97 99 01 03 05 07 09 11 13 15 17 19 21 23 252468101214S&P 500Q4 Operating Profit margin *(trailing 4-quarter, %)S&P 500 ( )95 97 99 01 03 05 07 09 11 13 15 17 19 21 23 2546810121416Q4 HEALTH CAREQ4( )S&P 500 Sectors OperatingProfit Margins95 97 99 01 03 05 07 09 11 13 15 17 19 21 23 2505101520 COMMUNICATION SERVICESQ4( )
6 95 97 99 01 03 05 07 09 11 13 15 17 19 21 23 252468101214Q4 INDUSTRIALSQ4( )95 97 99 01 03 05 07 09 11 13 15 17 19 21 23 2502468101214Q4 CONSUMER DISCRETIONARYQ4( )95 97 99 01 03 05 07 09 11 13 15 17 19 21 23 250510152025Q4 INFORMATION TECHNOLOGYQ4( )95 97 99 01 03 05 07 09 11 13 15 17 19 21 23 25468101214Q4 CONSUMER STAPLESQ4( )95 97 99 01 03 05 07 09 11 13 15 17 19 21 23 2502468101214Q4 MATERIALSQ4( )95 97 99 01 03 05 07 09 11 13 15 17 19 21 23 25-15-10-5051015Q4 ENERGYQ4( )95 97 99 01 03 05 07 09 11 13 15 17 19 21 23 25051015202530Q4 REAL ESTATEQ4( )95 97 99 01 03 05 07 09 11 13 15 17 19 21 23 25-15-10-5051015202530Q4 FINANCIALSQ4 Includes Real Estatethrough Q2-2016* Operating margin in percent and based on trailing 4-quarter EPS and sales.
7 Source: Standard & Poor s.( )95 97 99 01 03 05 07 09 11 13 15 17 19 21 23 2546810121416Q4 UTILITIESQ4( ) 500 Sectors Forecasted & Actual Profit MarginsPage 7 / March 5, 2022 / S&P 500 Sectors & Industries Profit Margins Research, 07 08 09 10 11 12 13 14 15 16 17 18 19 20 21 22 23 24468101214S&P 500Q4 Operating Profit margin *Actual 4Q TrailingImplied Forward06 07 08 09 10 11 12 13 14 15 16 17 18 19 20 21 22 23 2478910111213Q4 HEALTH CARES&P 500 SectorsForecasted & Actual Profit Margins06 07 08 09 10 11 12 13 14 15 16 17 18 19 20 21 22 23 2425811141720Q4 COMMUNCATION SERVICES06 07 08 09 10 11 12 13 14 15 16 17 18 19 20 21 22 23 2435791113Q4 INDUSTRIALS2/2306 07 08 09 10 11 12 13 14 15 16 17 18 19 20 21 22 23 24135791113Q4 CONSUMER DISCRETIONARY06 07 08 09 10 11 12 13 14 15 16 17 18 19 20 21 22 23 2451015202530Q4
8 INFORMATION TECHNOLOGY06 07 08 09 10 11 12 13 14 15 16 17 18 19 20 21 22 23 STAPLES06 07 08 09 10 11 12 13 14 15 16 17 18 19 20 21 22 23 2403691215Q4 MATERIALS06 07 08 09 10 11 12 13 14 15 16 17 18 19 20 21 22 23 24-15-10-50510152025Q4 ENERGY06 07 08 09 10 11 12 13 14 15 16 17 18 19 20 21 22 23 2451015202530 REAL ESTATEQ406 07 08 09 10 11 12 13 14 15 16 17 18 19 20 21 22 23 24-20-10010203040Q4 FINANCIALSI ncludes Real Estatethrough Q2-2016* Actual from S&P based on trailing 4-quarter EPS and sales. Forecast implied from I/B/E/S consensus forward EPS and sales, and pushed one year ahead. Source: Standard & Poor s Corporation (trailing 4-quarter margin ) and I/B/E/S data by Refinitiv (forward margin ).
9 06 07 08 09 10 11 12 13 14 15 16 17 18 19 20 21 22 23 500 Sectors Forecasted & Actual Profit MarginsPage 8 / March 5, 2022 / S&P 500 Sectors & Industries Profit Margins Research, 500 OPERATING Profit Margins : COMMUNICATION SERVICES(trailing 4-quarter EPS, percent)Communication Services Sector ( )Alternative Carriers ( )Integrated Telecommunication ( )Note: Sector data from S&P. Industry-level data uses I/B/E/S data from Refinitiv for EPS through Q4-2007, and S&P s EPS : Standard & Poor s, I/B/E/S data by Refinitiv, and Haver 500 OPERATING Profit Margins : COMMUNICATION SERVICES(trailing 4-quarter EPS, percent)Communication Services Sector ( )Advertising (NA)Broadcasting (NA)Cable & Satellite (NA)Publishing (NA)Note: Sector data from S&P.
10 Industry-level data uses I/B/E/S data from Refinitiv for EPS through Q4-2007, and S&P s EPS : Standard & Poor s, I/B/E/S data by Refinitiv, and Haver ServicesPage 5 / March 5, 2022 / S&P 500 Sectors & Industries Profit Margins Research, 500 OPERATING Profit Margins : COMMUNICATION SERVICES(trailing 4-quarter EPS, percent)Communication Services Sector ( )Interactive Home Entertainment (NA)Movies & Entertainment (NA)Note: Sector data from S&P. Industry-level data uses I/B/E/S data from Refinitiv for EPS through Q4-2007, and S&P s EPS : Standard & Poor s, I/B/E/S data by Refinitiv, and Haver ServicesPage 6 / March 5, 2022 / S&P 500 Sectors & Industries Profit Margins Research, 500 OPERATING Profit Margins : CONSUMER DISCRETIONARY(trailing 4-quarter EPS, percent)Consumer Discretionary Sector ( )Automobile Manufacturers ( )Auto Parts & Equipment ( )Motorcycle Manufacturers ( )Note: Sector data from S&P.