Example: biology
S-PLUS (and R) Manual to Accompany Agresti’s Categorical ...
1 Introduction and Changes from First Edition This manual accompanies Agresti’s Categorical Data Analysis (2002). It provides assistance in doing the statistical methods illustrated there, using S-PLUS and the R language.
Tags:
Information
Domain:
Source:
Link to this page:
Documents from same domain

Stochastic Processes - Stanford University
statweb.stanford.eduProbability, measure and integration 7 1.1. Probability spaces and σ-fields 7 ... minimal prior exposure to stochastic processes (beyond the usual elementary prob-

Accuracy of Individual Scores Expressed in Percentile ...
statweb.stanford.eduTesting and Reporting (STAR) program which uses the Stanford Achievement Test Series, Ninth Edition, Form T (Stanford 9), the 1998 Home Report and 1999 STAR Parent Report feature solely the National Grade Percentile Ranks.

How Accurate Are the STAR National ... - Stanford University
statweb.stanford.edufor two tests–Reading total and Math total for Stanford Achievement Test Series, Ninth Edition, Form T (Stanford 9). The specific norms and measurement information were provided by Harcourt Educational Measurement (most of this information is also in HEM publications).

Probability Theory: STAT310/MATH230 September 3,2016
statweb.stanford.eduCHAPTER 1 Probability, measure and integration This chapter is devoted to the mathematical foundations of probability theory. Section 1.1 introduces the basic measure theory framework, namely, the probability

ROBERTJOHNTIBSHIRANI - Stanford University
statweb.stanford.eduROBERTJOHNTIBSHIRANI December 2017 580 Saint Claire Dr. Palo Alto, California. 94306 ... Univ. of Washington- Data mining workshop Univ. of Waterloo Statistics seminar ... Ryan Tibshirani and Robert Tibshirani. Post-selection adaptive inference for …
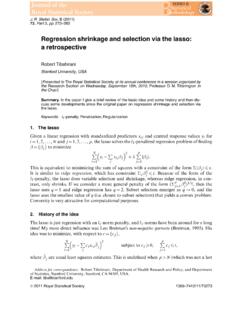
Regression shrinkage and selection via the lasso: a ...
statweb.stanford.eduRegression shrinkage and selection via the lasso: a retrospective Robert Tibshirani ... (Tibshirani et al., 2010). Given a data sequence y1,y 2,...,yN isotonic regression solves the problem of finding ... Iain Johnstone, Ryan Tibshirani and Daniela Witten. I thank the Research Section of the Royal Statistical Society for inviting me to present ...
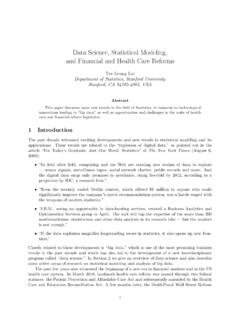
Data Science, Statistical Modeling, and Financial and ...
statweb.stanford.eduData science, therefore, includes high performance computing, data processing, development and management of databases, data warehousing, mathematical representations, statistical model- ing and analysis, and visualization with the goal of extracting information from the data collected
b '¨R f % b '³¨R«# '¤ ¥ - Stanford University
statweb.stanford.edub¥ '³D©ªi uß « b '¨R f % b '³ ¨R«# '¤ ¥ Ï#¤ ªi¯ ²U¦Ub¥ b ©¨ ® ªU¨R '³Ò¦U Ò b ¥s¨n b f©h« ¯sª< b G¡£¦U ¨R f¸U fJªi¯ ¯

1 Dispersion and deviance residuals - Stanford University
statweb.stanford.edu1 Dispersion and deviance residuals For the Poisson and Binomial models, for a GLM with tted values ^ = r( X ^) the quantity D +(Y;^ ) can be expressed as twice the di erence between two maximized log-likelihoods for Y i indep˘ P i: The rst model is the saturated model, i.e. where ^

Model Selection: General Techniques - Stanford University
statweb.stanford.eduModel selection: goals Model selection: general Model selection: strategies Possible criteria Mallow’s Cp AIC & BIC Maximum likelihood estimation AIC for a linear model Search strategies Implementations in R Caveats - p. 7/16 Model selection: general This is an “unsolved” problem in statistics: there are no
Related documents
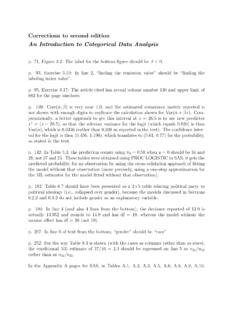
Corrections to second edition An Introduction to ...
users.stat.ufl.eduCorrections to second edition An Introduction to Categorical Data Analysis p. 71, Figure 3.2: The label for the bottom figure should be β < 0.

Introduction to Categorical Data Analysis - GSP Main Site ...
gis.humboldt.eduAn Introduction to Categorical DataAnalysis ... Introduction 1 1.1 Categorical Response Data, 1 1.1.1 Response/ExplanatoryVariable Distinction, 2 ... 4.3 Logistic Regression with Categorical Predictors, 110 4.3.1 IndicatorVariables Represent Categories of Predictors, 110

An Introduction to Categorical Data Analysis
library.mpib-berlin.mpg.deAn Introduction to Categorical Data Analysis Second Edition ALAN AGRESTI Department of Statistics University of Florida Gainesville, Florida 18O7 A JOHN WILEY & SONS, INC., PUBLICATION

Chapter 1 Introduction Analyzing Categorical Data
teachers.dadeschools.netChapter 1 1 Chapter 1 Introduction & 1.1: Analyzing Categorical Data Introduction Data Analysis: Making Sense of Data After this section, you should be able to…

Chapter 1 – Categorical Data Analysis
teachoutcoc.orgChapter 1 – Categorical Data Analysis Introduction: Statisticians, data scientists and data analysts analyze data all the time. Often, they analyze categorical data by looking at amounts, totals, percentages and decimal proportions. Note about Terminology: ...
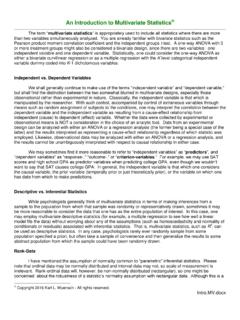
AN INTRODUCTION TO MULTIVARIATE STATISTICS
core.ecu.eduAn Introduction to Multivariate Statistics ... When all of the variables are categorical, log-linear analysis is appropriate. When it is reasonable to consider one of the variables as dependent and the others as independent, as in this study, a special type of log-linear analysis called a LOGIT ANALYSIS is employed. In the second experiment

Chapter 2 – Relationships between Categorical Variables
teachoutcoc.org44 Chapter 2 – Relationships between Categorical Variables Introduction: An important field of exploration when analyzing data is the study of relationships

Introduction to Categorical Semantics for Proof Theory ...
emorehouse.web.wesleyan.eduIntroduction to Categorical Semantics for Proof Theory (OPLSS 2015) Edward Morehouse Carnegie Mellon University June 2015 (revised June 15, 2015)

Introduction to Regression and Data Analysis - Yale University
statlab.stat.yale.eduIntroduction to Regression and Data Analysis with Dan Campbell and Sherlock Campbell ... continuous variables, or box-and-whisker plots for a continuous variable vs. a categorical variable. This preliminary data analysis will help you decide upon the appropriate tool

A BRIEF INTRODUCTION TO MULTIVARIATE ANALYSIS OF …
oak.ucc.nau.eduA BRIEF INTRODUCTION TO MULTIVARIATE ANALYSIS OF VARIANCE (MANOVA) Like the analysis of variance (ANOVA), the multivariate analysis of variance (MANOVA) has variations. For example, the one-way MANOVA contains a single factor (independent variable)
Related search queries
An Introduction, An Introduction to Categorical, Introduction to Categorical Data Analysis, An Introduction to Categorical DataAnalysis, Introduction, Categorical, An Introduction to Categorical Data Analysis, Introduction Analyzing Categorical Data, Analyzing Categorical Data Introduction, Categorical Data Analysis, Categorical Data Analysis Introduction, Multivariate Statistics, Chapter 2 – Relationships between Categorical Variables, Chapter 2 – Relationships between Categorical Variables Introduction, Introduction to Categorical Semantics for Proof Theory, Regression, BRIEF INTRODUCTION TO MULTIVARIATE ANALYSIS, BRIEF INTRODUCTION TO MULTIVARIATE ANALYSIS OF VARIANCE MANOVA, Multivariate analysis of variance MANOVA