Transcription of Section 5.0 : Derivation and Correlation of the …
1 Section : Derivation and Correlation of the Viscous Damping Coefficient By Martin J. King, 07/05/02 (Revised 08/22/03) Copyright 2002, 2003 by Martin J. King. All Rights Reserved. Page 1 of 16 Section : Derivation and Correlation of the Viscous Damping Coefficient In the equations derived in the preceding sections, the only variables that still need to be defined are the viscous damping coefficient and c the speed of sound. I tried a number of different expressions for , and numerical values for c, in an attempt to correlate the calculations with the test data, repeated from Section in Figures , , , and , for the stuffed test transmission line. I found that the best Correlation was achieved by expressing c and as functions of the stuffing density.
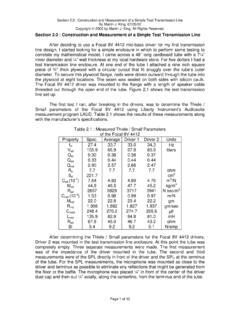
2 The following relationships between the speed of sound, the damping coefficient, the stuffing density, and frequency are empirical. There was no closed form equation used to determine these characteristics of the stuffed test transmission line. The values used for the speed of sound are 342 m/sec, 335 m/sec, 325 m/sec, and 320 m/sec for stuffing densities of lb/ft3, lb/ft3, lb/ft3, and lb/ft3 respectively. These values were arrived at after starting with the measured and calculated speeds of sound shown in Table The mathematical expression for the viscous damping coefficient ( ) is shown below. tube10newton sec m4 := fiberDft3lb 1570 newton sec m4 := Dft3lb Dft3lb +:= r tube fiberrd 50 Hz order 1rd 50 Hz order+ 1 +:= The expression for ( ) was arrived at by iterating the calculation with different constant values of viscous damping.
3 The first term tube represents a small loss that is applied to the empty tube. This keeps the empty tube calculations from growing to infinity at the quarter wavelength frequencies. The second term fiber represents the viscous damping coefficient for the fiber filled tube. Notice that this expression is linear with the stuffing density D. With only these two terms, I achieved good Correlation at the frequencies above 200 Hz. At the lower frequencies, the calculated response was over damped so I experimented with different high pass filter functions. The final expression for ( ) is modified by a high pass filter. The high pass filter starts as a second order filter and transitions to a first order filter as the stuffing density increases. Again, the expression for ( ) and the values for c were arrived at empirically to recreate the test data shown in Figures , , , and In Figure the expressions for the speed of sound and the damping coefficient have been plotted.
4 The speed of sound plot, at the top of the page, shows that the minimum speed of sound for stuffing densities less than lb/ft3 is approximately 319 m/sec. This corresponds to a process approximately midway between adiabatic and Section : Derivation and Correlation of the Viscous Damping Coefficient By Martin J. King, 07/05/02 (Revised 08/22/03) Copyright 2002, 2003 by Martin J. King. All Rights Reserved. Page 2 of 16 isothermal. The figure just below shows the frequency dependent damping coefficient curves for lb/ft3, lb/ft3, lb/ft3, lb/ft3, and lb/ft3 as seen from top to bottom in the plot. From this second plot it can be seen that as the stuffing density and frequency increase, so does the magnitude of the damping coefficient. The MathCad computer program was used to perform all of the calculations using the TL Open worksheet.
5 When you look at MathCad worksheets keep in mind that all of the calculations are performed on column vectors with each position in the vector corresponding to a specific frequency. Also recognize that MathCad accepts whatever units are entered and converts them to a consistent set of default units for all of the calculations. Therefore, I tend to work with the length L expressed in inches and the Thiele / Small parameters expressed in metric units. Plots showing the calculated impedance and the SPL magnitude and phase response, for the woofer and the terminus, are shown in Figures , , , and for the empty test line and the test line with 100 gm, 200 gm, and 300 gm of Dacron Hollofil II stuffing. These plots also contain the measured impedance and SPL overlaid as dashed lines to show the accuracy of the computer model relative to the test data.
6 Again the terminus SPL phase plots were used to identify the calculated resonant frequency for each mode. At the quarter wavelength frequencies, the phase angle passes through +90 degrees or -90 degrees. The impedance curves were used to identify the calculated shifted driver resonant frequency. Table shows these results. Table : Calculated Resonant Frequencies for the Unstuffed and Stuffed Test Line Mode Unstuffed Line (Hz) 100 gm of Hollofil Stuffing (Hz)200 gm of Hollofil Stuffing (Hz)300 gm of Hollofil Stuffing (Hz)Driver 22 22 24 26 1/4 Wavelength 93 96 96 95 3/4 Wavelength 212 210 205 200 5/4 Wavelength 340 332 320 315 7/4 Wavelength 471 457 440 432 9/4 Wavelength 603 583 561 551 11/4
7 Wavelength 735 710 683 670 After comparing the measured and calculated results shown in Figures through , and the measured and calculated resonant frequencies presented in Tables and , I concluded that the MathCad computer model was in excellent agreement with the test data. Getting test data and calculated results to agree to this degree indicated that the computer model was technically sound and could be used as a design tool for transmission line enclosures. The same sets of measurements were also performed using long fiber wool. The wool was a much courser fibrous tangle with a larger fiber diameter than the Dacron Hollofil II. The number of wool fibers in a given volume, for the same packing density, was probably significantly less than the number of Dacron fibers.
8 The measured results were similar in appearance to those shown in Figures , , and Based on this second set of plots, it appeared that the wool might provide a little less viscous damping for the same packing density. If there are fewer wool fibers per unit volume, then it makes sense that the amount of viscous damping is lower. I concluded that there is no magic associated with a wool stuffed transmission line. From these results, and the Section : Derivation and Correlation of the Viscous Damping Coefficient By Martin J. King, 07/05/02 (Revised 08/22/03) Copyright 2002, 2003 by Martin J. King. All Rights Reserved. Page 3 of 16 inherent problems of smell and insects associated with wool, I decided that the Dacron Hollofil II was the best choice for all of my transmission line designs.
9 Summary : The speed of sound and the damping coefficient for a fiber filled transmission line have been derived empirically from the measured test line data. These relationships have been included in the TL Open MathCad worksheets and the test line modeled with the Focal 8V 4412 driver in one end. The calculated results and the measured data have been plotted in the same graphs and show excellent Correlation . Section : Derivation and Correlation of the Viscous Damping Coefficient By Martin J. King, 07/05/02 (Revised 08/22/03) Copyright 2002, 2003 by Martin J. King. All Rights Reserved. Page 4 of 16 Figure : Unstuffed Test Line Section : Derivation and Correlation of the Viscous Damping Coefficient By Martin J. King, 07/05/02 (Revised 08/22/03) Copyright 2002, 2003 by Martin J.
10 King. All Rights Reserved. Page 5 of 16 Figure : Test Line Stuffed With 100 gm of Dacron Hollofil II Section : Derivation and Correlation of the Viscous Damping Coefficient By Martin J. King, 07/05/02 (Revised 08/22/03) Copyright 2002, 2003 by Martin J. King. All Rights Reserved. Page 6 of 16 Figure : Test Line Stuffed With 200 gm of Dacron Hollofil II Section : Derivation and Correlation of the Viscous Damping Coefficient By Martin J. King, 07/05/02 (Revised 08/22/03) Copyright 2002, 2003 by Martin J. King. All Rights Reserved. Page 7 of 16 Figure : Test Line Stuffed With 300 gm of Dacron Hollofil II Section : Derivation and Correlation of the Viscous Damping Coefficient By Martin J. King, 07/05/02 (Revised 08/22/03) Copyright 2002, 2003 by Martin J. King. All Rights Reserved. Page 8 of 16 Figure : Speed of Sound and Damping Coefficient as Functions of Stuffing Density for Dacron Hollofil II Fiber of Sound in Stuffed TLStuffing DensitySpeed of Sound (m/sec)cfiberqq D Coefficient and Stuffing DensityFrequency (Hz)Damping Coefficient (N-sec/m^4) Hz Section : Derivation and Correlation of the Viscous Damping Coefficient By Martin J.