Transcription of Section Page
1 Introduction ..1 Objectives .. Successful Versus Unsuccessful Go/No Go Decisions .. An In-service Perspective On Go/No Go Decisions .. Successful Go/No Go Decisions .. RTO Overrun Accidents and Incidents .. Statistics .. Lessons Learned .. Decisions and Procedures What Every Pilot Should Know .. The Takeoff Rules The Source of the Data .. The FAR Takeoff Field Length .. V1 Speed Defined .. Balanced Field Defined .. (Not Used) .. Transition to the Stopping Configuration .. Flight Test Transitions .. Airplane Flight Manual Transition Times.
2 Comparing the Stop and Go Margins .. The Stop The Go Option .. Operational Takeoff Calculations .. The Field Length Limit Weight .. Actual Weight Less Than Limit Weight .. Factors that Affect Takeoff and RTO Runway Surface Condition .. Hydroplaning .. The Final Stop .. Atmospheric Conditions .. Airplane Configuration .. Engine Bleed Air .. Missing or Inoperative Equipment .. Guide to Takeoff SafetyTable of ContentsSection PageSECTION Wheels, Tires, and Brakes .. Worn Brakes .. Residual Brake Energy .. Speedbrake Effect on Wheel Braking.
3 Carbon and Steel Brake Differences .. High Brake Energy RTOs .. Reverse Thrust Effects .. Runway Parameters .. (Not Used) .. Takeoffs Using Reduced Thrust .. The Takeoff Data the Pilot Sees .. Increasing the RTO Safety Margins .. Runway Surface Condition .. Flap Selection .. Runway Lineup .. Setting Takeoff Thrust .. Manual Braking Techniques .. Antiskid Inoperative Braking Techniques .. RTO Autobrakes .. (Not Used) .. The V1 Call .. Crew Preparedness .. Crew Resource Management .. CRM and the RTO .. The Takeoff Briefing.
4 Callouts .. The Use of All Crew Members .. Summary .. IntroductionThe Pilot Guide to Takeoff Safety is one part of the Takeoff Safety Training Aid. The other parts include the Takeoff Safety Overview for Management ( Section 1), Example Takeoff Safety Training Program ( Section 3), Takeoff Safety Background Data ( Section 4), and an optional video. The subsection numbering used in Sections 2 and 4 are identical to facilitate cross referencing. Those sub sections not used in Section 2 are noted not used .The goal of the training aid is to reduce the number of RTO related accidents by improving the pilot s decision making and associated procedural accomplishment through increased knowledge and awareness of the factors affecting the successful outcome of the Go/No Go h e e d u c a t i o n a l m a t e r i a l a n d t h e recommendations provided in the Takeoff Safety Training Aid were developed through an extensive review process to achieve consensus of the air transport.
5 1 ObjectivesThe objective of the Pilot Guide to Takeoff Safety is to summarize and communicate key RTO related information relevant to flight crews. It is intended to be provided to pilots during academic training and to be retained for future Successful Versus Unsuccessful Go/No Go DecisionsAny Go/No Go decision can be considered successful if it does not result in injury or airplane damage. However, just because it was successful by this definition, it does not mean the action was the best that could have been taken.
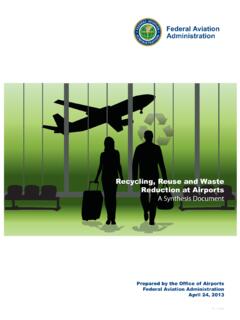
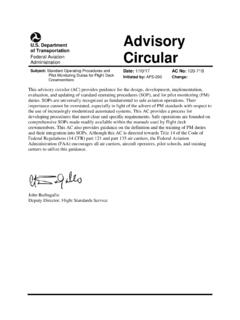
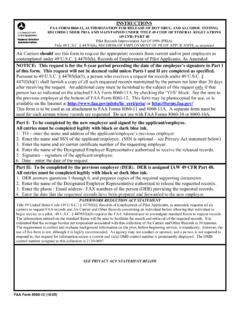
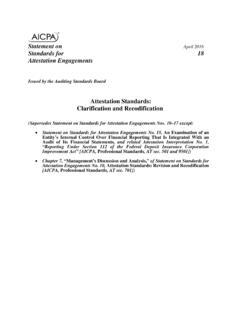
6 The purpose of this Section is to point out some of the lessons that have been learned through the RTO experiences of other airline crews since the 1950s, and to recommend ways of avoiding similar experiences by the pilots of today s airline Guide to Takeoff SafetyTakeoffs, RTOs, and Overruns Through 2003 Typical Recent Year Takeoffs 430,000,00018,000,000 RTOs (est.) RTO Overrun Accidents/Incidents143,0006,000974* 1 RTO per 3,000 takeoffs 1 RTO overrun accident/incident per 4,500,000 takeoffs*Accidents/incidents that would occur if historical rates 1 Takeoffs, RTOs, and Overrun An In-service Perspective On Go/No Go DecisionsModern jet transport services began in the early 1950s and significantly increased later that decade after introduction of the Boeing 707 and the Douglas DC-8.
7 As shown in Figure 1, the western built jet transport fleet has accumulated approximately 430 million takeoffs by the end of 2003. Recently there have been nearly 18 million takeoffs in a typical year. That s approximately 34 takeoffs every minute, every day!Since no comprehensive fleet-wide records are available, it is difficult to identify the total number of RTOs that have occurred throughout the jet era. However, based on those events which have been documented, our best estimate is that one in 3,000 takeoff attempts ends with an RTO.
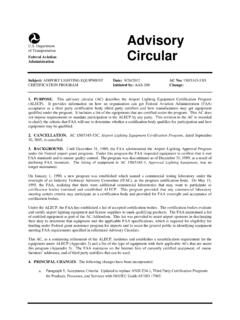
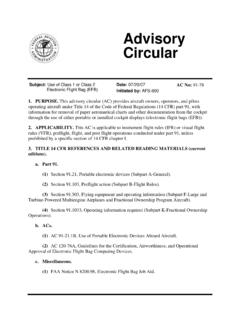
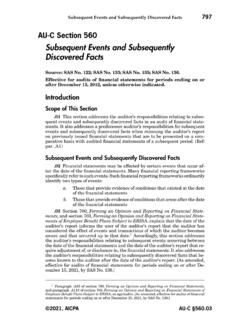
8 At this rate, there will be nearly 6000 RTOs during a typical year. That means that every day, 16 flight crews will perform an RTO. Statistically, at the rate of one RTO per 3000 takeoffs, a pilot who flies short haul routes and makes 80 departures per month, will experience one RTO every three years. At the opposite extreme, the long haul pilot making only eight departures per month will be faced with only one RTO every 30 probability that a pilot will ever be required to perform an RTO from high speed is even less, as is shown in Figure data indicates that over 75% of all RTOs are initiated at speeds of 80 knots or less.
9 These RTOs almost never result in an accident. Inherently, low speed RTOs are safer and less demanding than high speed RTOs. At the other extreme, about 2% of the RTOs are initiated at speeds above 120 knots. Overrun accidents and incidents that occur principally stem from these high speed should all these statistics tell a pilot? First, RTOs are not a very common event. This speaks well of equipment reliability and the preparation that goes into operating jet transport airplanes. Both are, no doubt, due in large part to the certification and operational standards developed by the aviation community over many years of operation.
10 Second, and more important, the infrequency of RTO events may lead to complacency about maintaining sharp decision making skills and procedural effectiveness. In spite of the equipment reliability, every pilot must be prepared to make the correct Go/No Go decision on every takeoff-just in 2 Distribution of RTO Initiation Speeds KNOTSOR LESS TO KNOTS TO KNOTS!BOVE KNOTS0 ERCENTOF TOTAL 24/ OVERRUNACCIDENTSPRINCIPALLY COME FROM THE OF THE 24/S THAT AREHIGH Successful Go/No Go DecisionsAs was mentioned at the beginning of Section , there is more to a good Go/No Go decision than the fact that it may not have resulted in any apparent injury or aircraft damage.