Transcription of SELECTED SUSTAINABLE DEVELOPMENT TRENDS IN
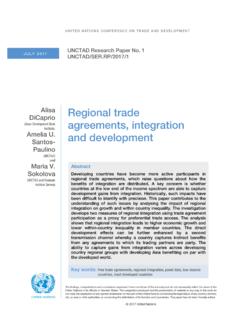
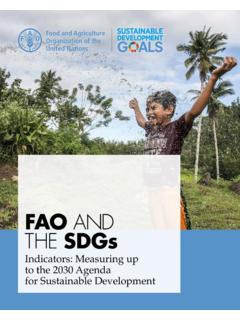
1 UNITED NATIONS CONFERENCE ON TRADE AND DEVELOPMENTSELECTED SUSTAINABLE DEVELOPMENT TRENDS IN THE LEAST DEVELOPED COUNTRIES 2018 Geneva, 2018 UNITED NATIONS CONFERENCE ON TRADE AND DEVELOPMENTSELECTED SUSTAINABLE DEVELOPMENT TRENDS IN THE LEAST DEVELOPED COUNTRIES 2018 Geneva, 2018 The designations employed and the presentation of material on any map in this work do not imply the expression of any opinion whatsoever on the part of the United Nations concerning the legal status of any country, territory, city or area or of its authorities, or concerning the delimitation of its frontiers or and updated economic and social statistical data on the least developed countries can be accessed in the following UNCTAD publication: Statistical Tables on the Least Developed Countries 2017, available at: publication has not been formally edited. 2018, United Nations Conference on Trade and DevelopmentUNCTAD/ALDC/2018/1 Note SLOWDOWN IN GROWTH TOOK LDCs FARTHER AWAY FROM SDG TARGETSFALLING EXPORTS AND FDI, AND STAGNANT AID FLOWS CONSTRAIN LDCs ACCESS TO DEVELOPMENT FINANCEPOLICY IMPLICATIONSSDG target at least 7% GDP growth per annum in the LDCsFewer LDCs meeting 7% GDP growth targetLDCs total export revenues ($ billion)FDI inflows to LDCs ($ billion)Net ODA disbursements to LDCs ($ billion)
2 LDC share of global exports fallingIndustry's contribution to GDP stagnantWeak global demand and low commodity prices have shrunk LDC export revenues by support to the LDCs needs to accompany the moderate global rebound, if SDGs are to be met Structural transformation is critical for LDCs to embark on a SUSTAINABLE DEVELOPMENT pathTransformational energy access is key to unlock higher-productivity activitiesFDI inflows to LDCs fell in 2016 (-13%, compared with a decline of 2% worldwide)Aid flows to LDCs remain far below the SDG targets, and levelled-off in 2016 (+ in real terms)SDG target double the LDCs share of global exports by 2020 SDG target double industry s share of GDP in the LDCs200720122017 IPOA/SDG targetActual target19394338434376-9675-965141725%26%2 5%ForewordThis document is a contribution to the United Nations system s efforts to follow up and monitor the implementation of Agenda 2030 for SUSTAINABLE DEVELOPMENT , since it reviews recent progress against SELECTED targets and indicators related explicitly to the 47 least developed countries (LDCs).
3 Its conceptual starting point can be traced to paragraph 27 of the Agenda, and the stated commitment to build strong economic foundations for all our countries (.. and) strengthen the productive capacities of least developed countries in all sectors, including through structural transformation . In line with the above, the document presents a brief assessment of recent economic TRENDS and progress towards SELECTED SUSTAINABLE DEVELOPMENT Goals (SDGs) targets and indicators in the In doing so, it highlights some of LDCs key DEVELOPMENT challenges, which stem from their own domestic conditions, but also from the specific terms of their interdependence within the global economy. Far from providing a full-fledged country-specific assessment, this document emphasises predominantly the latter international dimension, consistently with the view, expressed in paragraph 3 of the Nairobi Maafikiano, that while each country has primary responsibility for its own economic and social DEVELOPMENT , the support of an enabling international environment is integral to the success of national efforts (UNCTAD, 2016a).
4 The structure of the document is as follows. Section A discusses the performance of LDCs in terms of broad macroeconomic TRENDS and inclusive growth, while section B delves into their implications for industrialization and structural transformation. Section C tackles key trade-related issues and balance of payment vulnerabilities; while section D is devoted to the mobilization of DEVELOPMENT finance, through different sources. Finally, section E summarizes LDCs outlook for the near-term SUSTAINABLE DEVELOPMENT TRENDS in the leaSt developed countrieS 2018 ContentsA. Economic growth ..2B. Structural transformation ..7C. International trade and current account ..101. Trade in goods and services ..112. Current account balance ..15D. Resource mobilization ..171. Domestic resource mobilization ..182. Official capital flows ..193. Foreign direct investment (FDI).
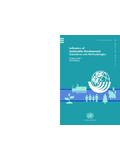
5 214. Personal remittances ..22E. The economic outlook for least developed countries ..24 Notes ..25 References ..27 SELECTED SUSTAINABLE DEVELOPMENT TRENDS in the leaSt developed countrieS 2018 SELECTED SUSTAINABLE DEVELOPMENT TRENDS in the LDCs 2018 2A. Economic growth Sustain per capita economic growth in accordance with national circumstances and, in particular, at least 7 per cent gross domestic product growth per annum in the LDCs (Agenda 2030 target )Real GDP per capita in LDCs rosefrom $639 in 2016 to only $655 in 2017but fell in 9 countries in 2017.$639in 2016$655in 20175 LDCs attained SDG target * in 2017:Bangladesh Djibouti EthiopiaMyanmarNepal*at least +7% GDP growth per annum in the LDCsSelected SUSTAINABLE DEVELOPMENT TRENDS in the LDCs 2018 3 After weathering reasonably well the aftermath of the 2009 great recession, in the 2015-2016 biennium the LDCs bore the brunt of the global trade slowdown and of the anaemic recovery associated with insufficient global demand and mounting levels of inequality (UNCTAD, 2017a).
6 In 2016 the LDC combined gross domestic product (GDP) experienced its lowest real growth rate since the beginning of the century ( per cent), with as many as 14 LDCs (out of 45 for which individual country data is available) suffering a deterioration of real GDP per Preliminary data for 2017 and projections thereafter suggest that some improvements are indeed taking place, with LDC growth rate back at 5 per cent in 2017 and a projected for 2018. The picking up of the global economy, however, may well take some time to consolidate and touch a greater number of countries. Moreover, a number of risk factors, including unresolved flaws in the prevailing economic policy framework, as well as heightened policy uncertainties, loom large on this tepid recovery (UNCTAD, 2017a; World Bank, 2017).The above situation can be traced to the prevailing conditions of the world economy, and most notably to:1.
7 The anaemic recovery of developed economies, where aggregate demand has remained stifled by austerity measures, high levels of inequality, and uncertain animal spirits on the part of investors, notwithstanding expansionary monetary policies and bullish financial markets;2. the slowdown of other ( non-LDC) developing countries (especially outside the East Asian region), with several so-called emerging economies becoming increasingly vulnerable to trade and financial shocks; and 3. the consequences of the strategic reorientation towards domestic-led growth in China, which has affected world demand for key commodities (UNCTAD, 2017a; Aky z and Yu Ill, 2017).Unless these issues are tackled through adequate and concerted policy efforts, there is a risk that a protracted lukewarm recovery will render it difficult for LDCs to generate and mobilize sufficient resources to strengthen their productive capacities, and foster economic diversification.
8 This might also prolong or possibly even worsen the divergence between LDCs and other developing countries (ODCs), as the two groups of countries have displayed broadly similar rates of GDP growth since 2010, with LDCs experiencing a slower expansion in per capita terms. If the 2015-2016 biennium witnessed a generalized downward levelling of GDP growth rates across LDCs, the timing and magnitude of this slowdown, as well as the pace of the ensuing rebound, varied across economies and regions, depending on structural socio-economic features, as well as idiosyncratic factors (Table 1). In African LDCs and Haiti by far the largest and more numerous subgroup of LDCs real GDP growth rate peaked in 2013 (+ per cent), declined in the two following years (bottoming down at + per cent in 2016), and recovered thereafter.
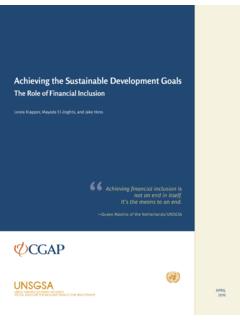
9 Though on the positive side the rebound is expected to somewhat strengthen in 2018, GDP growth rates will likely continue to fall short not only of their 2002-2008 average, but also of their 2010-2014 levels. In Asian and Island LDCs, conversely, growth rates bottomed slightly earlier (already in 2015) but also witnessed an earlier and more pronounced rebound, particularly in the case of Asian LDCs. Figure 1 Real GDP growth by country groups(Constant 2005 dollars)Per cent-4-2024682002-2008 200920102011201220132014201520162017 (p)2018 (p)LDCsOther developing countriesDeveloped economiesSource: UNCTAD secretariat calculations based on data from IMF, World Economic Outlook database (accessed January 2018).Notes: Calculation is based in applying GDP constant national currency growth to GDP current 2005 dollar and chained. (p) = SUSTAINABLE DEVELOPMENT TRENDS in the LDCs 2018 4 Table 1 Dynamics of real GDP and real GDP per capita in LDCs, 2002 2018 Annual percentage growth of real GDP2002 LDCs and percentage growth of real GDP per LDCs and GDP per capita relative to ODCs (percentage) LDCs and GDP per capita relative to developed countries (percentage) LDCs and : UNCTAD secretariat calculations, based on data from IMF, World Economic Outlook database (accessed January 2018).
10 Notes: Data for 2017 and 2018 are above pattern is largely consistent with the fact that African LDCs typically display a higher reliance on raw materials and primary commodities exports, with fuels accounting on average for nearly half of their merchandise exports revenues. Such heightened levels of export concentration on a narrow range of primary commodities expose countries to large exogenous shocks and ensuing boom-bust cycles, through reductions in the direct contribution of commodity industries to GDP, lower public revenues, as well as through contractions in export revenues and possibly FDI inflows (UNCTAD, 2013a, 2016b).Against this background, international prices for most primary commodity categories have trended upwards since the late 2016, but this modest recovery barely made a dent to the significant drop experienced since 2011, particularly in the case of crude petroleum and minerals, ores and metals (Figure 2).